The danger of data mining in sports betting strategies: How to avoid falling into the trap?

This article has been written by Daniel Muñoz, you can follow him on Twitter DANI84 @DMN1984ADS.
From Betaminic we thank Dani for the excellent work done to prepare this article and to share with all of us his extensive knowledge and experience in the field of statistics applied to sports betting.
In recent times betting strategies based on profitable patterns obtained from data mining have become very fashionable, this is something like searching large databases with historical results and odds. Today there are many platforms that sell specialized software or they sell their forecasts like any other tipster in the market; the objective of this article is to analyze one of these platforms, “Betaminic”, which arose some time ago and which has now decided to take a more professional step. For this analysis, we will use as an example some of the public strategies of this platform to date and we will analyze them graphically, in order to identify to what extent their results are the result of profitable patterns or market inefficiencies. In order to make this article accessible to all the public, we will use a simple language and we will omit mathematical formulas, representing the results in graphic format.
Searching in the databases
To explain this point we are going to give a fictitious example that can be given at any time:
Let’s say that we have a quite considerable database, in it, we have registered more than 50 leagues with results, closing odds of Pinnacle Sports and other variables. We found that betting on the away team has been consistently profitable in a couple of leagues in the last 3 years, and we have obtained a 12% yield which is not bad.
But is this really so simple?
Obviously not, and most likely, these results are largely the result of chance, but be careful because this does not mean that a small part of that profitability would have given us the market and is a pointless inefficiency that sooner or later will be corrected. The routine of many bettors who handle premium software specialized in the subject is precisely that commented above, find a profitable pattern in that series and mistakenly believe that there is a causality and that this pattern will continue to occur in the future.
That’s when the bettor who has identified that pattern believes he has the holy grail and the time has come to invest real money to replicate those bets in the coming series, but then the usual thing happens that the thing is not as expected and now betting on favor of the away team in that couple of leagues incur losses, and now checking the values of this new series what is giving positive yield is to bet on the home team. The bettor is very confused and returns to backtest with his specialized software, now he has realized that betting on under 2.5 goals in another couple of leagues has almost a 10% yield in recent seasons, but he no longer trusts what you see and this time to be sure will apply a series of filters:
– It will select only the teams whose games have had the most % unders.
– It will select only odds within a range.
Back to start, it’s time to put real money into this strategy that has also been optimized and that in the backtest has gone from 10% to 25% yield with this small optimization, something that looks promising…
This new series begins and the pattern that was given in the past is not at all like the results that are happening in those leagues, the under teams are not so under and the odds range selected has a negative yield.
What happened?
Well, the expected thing has happened, the data has returned to the average and the market has been self-correcting again being quite efficient. This fictitious bettor has made big mistakes. First, the bettor has not considered fundamental variables in the filters and therefore what had discovered was not a profitable pattern but a random pattern and, moreover, has squeezed the filters adapting the series analyzed. This is called optimization and is the biggest danger we can find when we use data mining.
If in addition to having found a random pattern we apply filters such as selecting only some teams that have been profitable, the pattern becomes even more random. What we are doing is adapting the data to our interest, which is none other than finding the combination that gives us the highest yield possible, but it is not as simple and in fact as I mentioned, what we will find most of the time they are random patterns that in the next series will behave in a totally different way.
Analysis of Betaminic strategies
In Betaminic they offer as a flagship product four betting strategies that have obtained excellent results in the past, the strategies are as follows:
- E1: “ALL LEAGUES Draw breaking the trend”
- E2: “ALL LEAGUES Home Team bad streak”
- E3: “ALL LEAGUES Home Team Not scoring”
- E4: “ALL LEAGUES Over 2.5 against the trend”
The four strategies have a very similar routine, to bet on a certain option in a match when a series of pre-established conditions are met. On the one hand, we have what I call control variables (C) and on the other side fundamental variables (F). When the system gives an alert the bet is made.
For example, the strategy of betting on the “Draw” has two control variables:
C1: Opening odds at Pinnacle Sports of the home team @2,00 – @2,70
C2: Opening odds at Pinnacle Sports of Over 2.5 goals @2,20 – @1000
These control variables are used to make a prior classification of the matches since, being an automatic system; it is not possible to perform a preliminary fundamental analysis to make the selection. Therefore, we will take it as such without taking anything for granted, not even the danger of being over optimizing from a good start.
Fundamental variables:
F1: Home team must have at least 1 game streak without a draw (at home & away).
F2: Away team must have a run of 2-3 games without a draw (at home & away).
The idea of the strategy is to expect a regression to the mean. With the control variables that we have applied, the bookmaker has done the first part of the work and has thrown us a series of matches where, for the opening odds, we have fairly balanced matches
In the second part, with the F variables, the idea is to bet on the draw with its closing odds in Pinnacle thinking that when this small streak exists the market has set that draw a bit higher than it should and could exist value.
The other strategies have a foundation quite similar to that explained above. Let’s see below a graph with the backtest of the four strategies
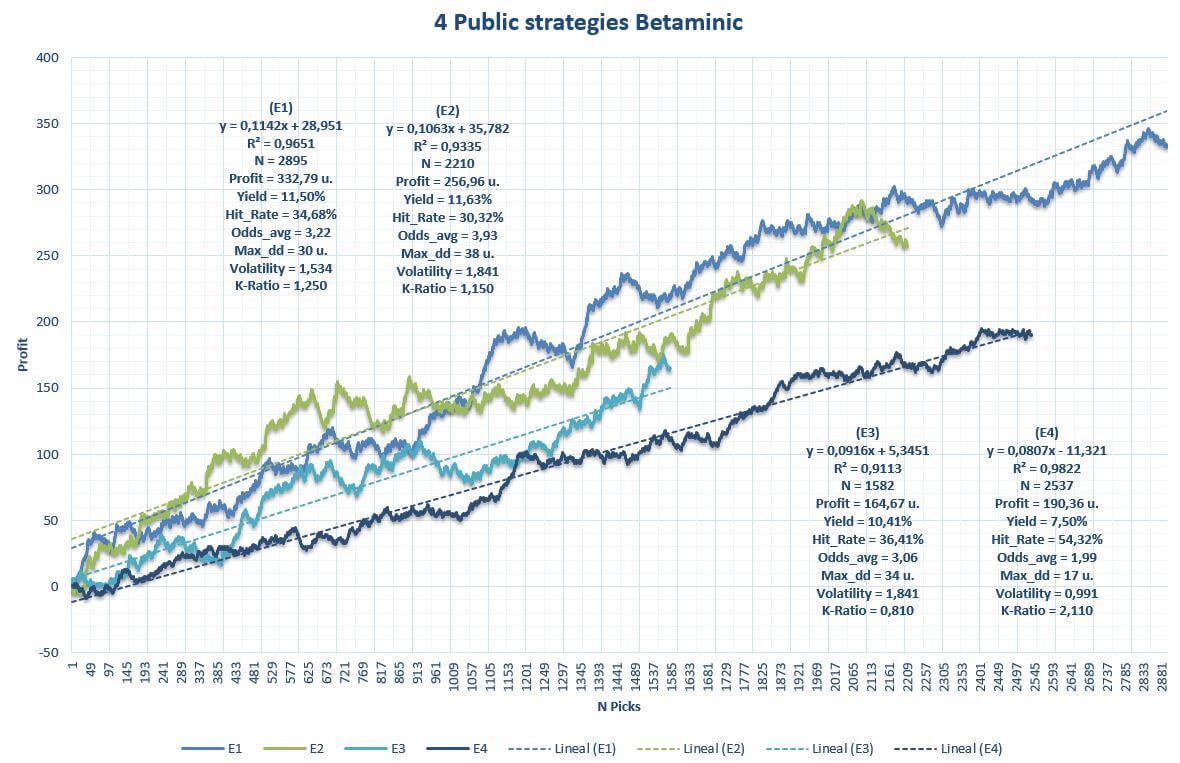
The graph shows the cumulative benefit along with quantitative variables of the strategies. From the outset, the results are spectacular both in yield and volatility, and also the sample of each strategy is > 1,500 picks in all cases. The drawdown is more than acceptable for a large number of picks and the straight lines draw a fairly consistent profit over time.
Are these results statistically significant?
We can perform a hypothesis test for the assumption that the results of these strategies have been the result of chance:
Null hypothesis: the results are the result of luck.
Alternative hypothesis: the results are the result of something that is not luck.
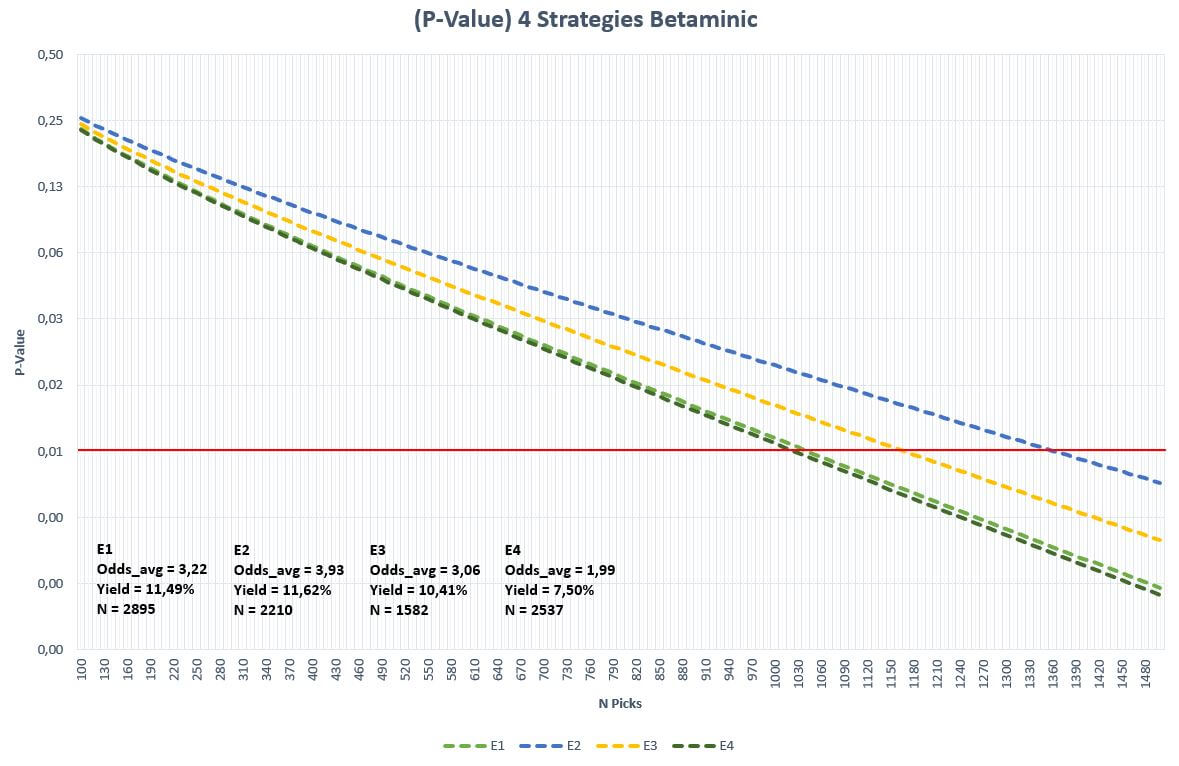
To be sure, we are going to set the level of significance at 1% (0.01). Then, taking the data of the yield, a number of picks and average odds, the lines represented in the graph are obtained. When the dashed line of each strategy crosses the horizontal red (1% significance), we can affirm that the result of that sample is statistically significant rejecting the null hypothesis and validating the alternative, which in this case suggests that the results do not come from the random.
As can be seen in the graph, for the yield levels of the strategies, the number of picks needed for this statistical significance has already been exceeded in the four cases. Is this sufficient proof that the results are not the result of chance? Let’s continue analyzing.
Discover 8 new profitable football betting systems based on Big Data clicking here!!!
Diversify
In Betaminic they suggest us to diversify our investment, and given that the four strategies are winning (in theory), the ideal is to apply all four at once betting a unit each time one of the systems gives a signal.
What if several strategies fall into losses at the same time?
My recommendation for whoever is going to use several strategies at the same time is to analyze the correlation among them. Ideally, they are not very correlated with each other. This will prevent the streaks of a strategy are added on the streaks of others causing a great disaster to our bank before a possible joint bad run. To ensure this last point, we can create a matrix using the Pearson correlation (r) to observe the degree of correlation among the strategies as shown below:
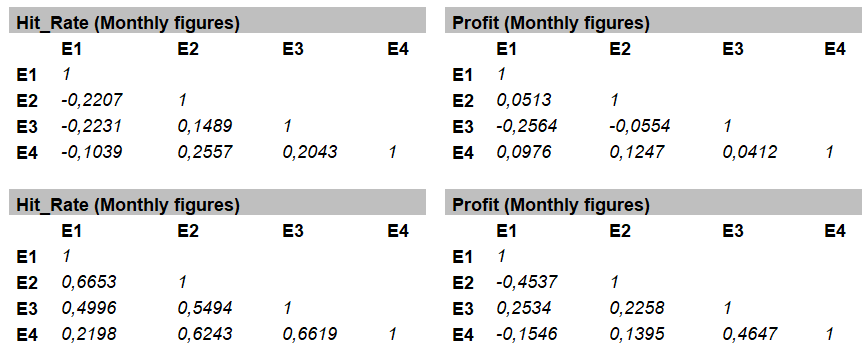
In this case, I have used two variables, Hit_Rate and Profit, with monthly and annual data, since the sample of picks is quite considerable.
The correlation coefficient indicates the degree of linear relationship between two variables and returns values between +1 and -1. If there is positive correlation the values will be> 0, if there is a negative correlation the values will be <0, and if there is no relationship these values will be quite close to zero. Values close to the extremes +1 and -1 indicate a strong positive or negative correlation. Therefore, what we are looking for here are values as close to 0 as possible. For the case that concerns us, I consider that there is a significant positive correlation from +0.7 and -0.7 for a negative correlation.
In the analyzed data, no significant correlation values were observed between the Betaminic strategies in monthly data nor in annual data, although the latter does return some higher coefficient between any of the variables, but nothing significant. Therefore, we could conclude that the strategies are not correlated and the results are not related to each other. This statement I always make with the caution of course.
The balance of results of the four strategies applied at the same time
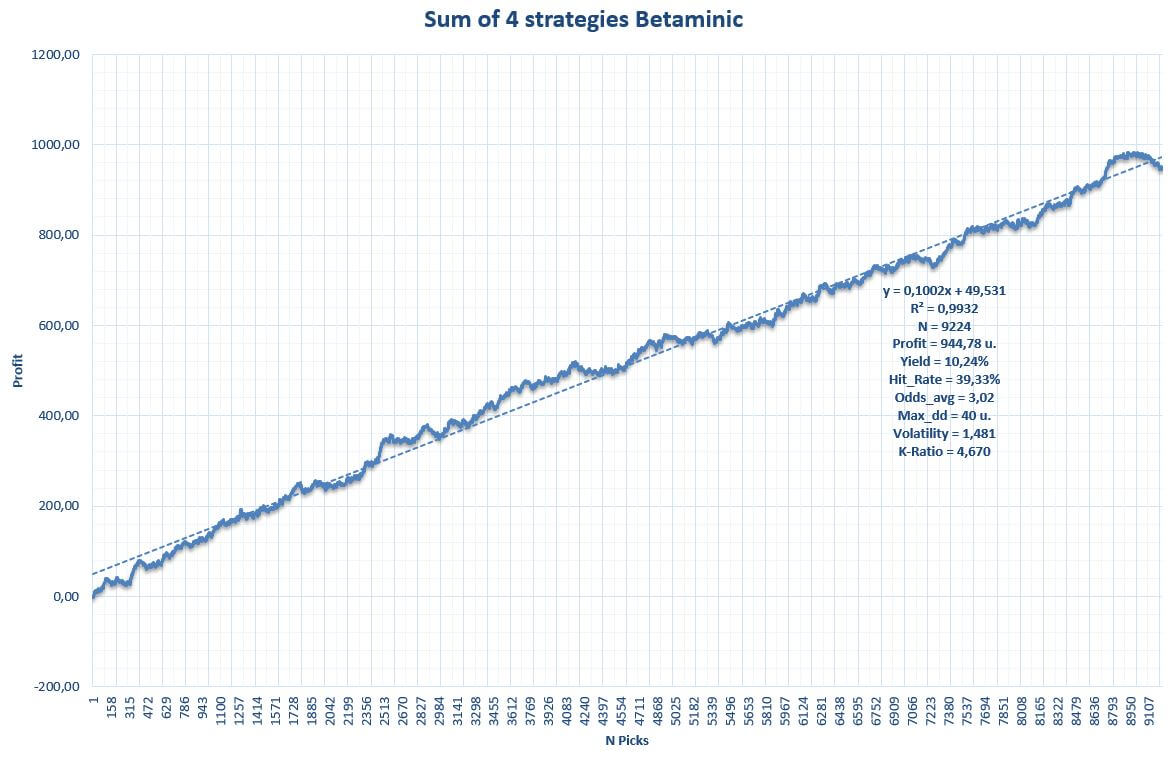
In more than 5 seasons, the global system of the four strategies has left a total of 9,224 picks with a yield above 10% and an almost insignificant volatility based on the average odds and the historical record.
Below we analyze the last graph where the Hit_Rate obtained compared to the minimum Hit_Rate necessary to avoid losing, divided by odds ranges.
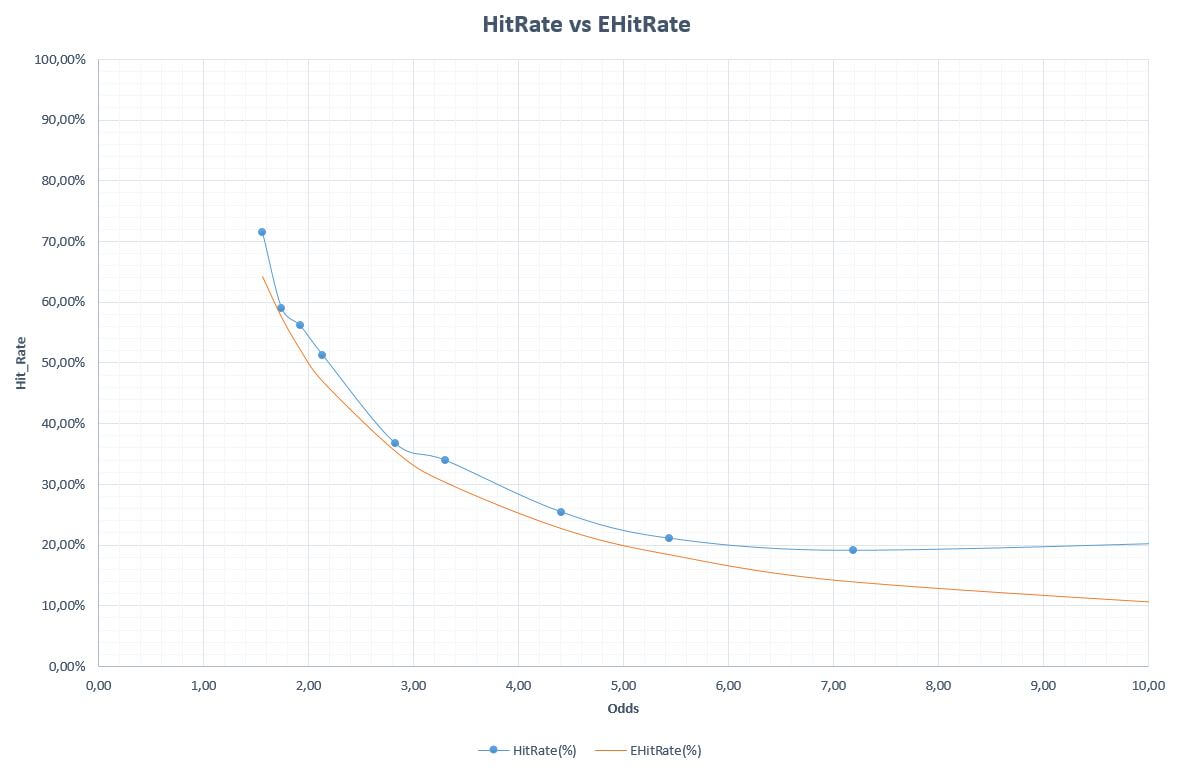
Amazing, the global system is the winner in all the odds intervals and this is perhaps one of the most interesting and encouraging graphics for those who decide to use these systems to bet.
Caution
With figures such as these, it seems that these strategies are really good and in fact I know that there are many users who follow them, but these issues must be treated with the utmost caution since, as I mentioned in this article, there may well be a causality in the patterns that we find in many data series, but do not forget that in every series there is part of luck and this cannot be underestimated by the bettor.
For example, if we look carefully at the strategy of betting on the draw proposed by Betaminic, we can see how, if we use only the control variables C1 and C2 that theoretically should not influence the expected value, they do. Taking these variables, the system finds just over 16 thousand picks in the database and its expected yield should be around -2.6%. Instead, a value close to + 1.7% is obtained and this is nothing but chance. Therefore, although the strategy achieves a yield greater than 10%, part of this success can be said to be helped by favorable chance.
To conclude this article I must remember in favor of Betaminic that they use no more and no less than closing odds to calculate the results, and these odds represent the point of maximum efficiency of the market in the long term. In addition, there is no filter by leagues, coming into play more than 50 of them from different countries.
In my opinion, these strategies are a very original idea that in the backtest they have given very good results and there seems to be a causality that explains them to a great extent, but I would recommend to all users who decide to follow them to study the market well. Let’s not forget that past performance is not a guarantee of future performance.
About the Author. Dani is passionate about football, the world of betting and statistics at all levels, not only in the field of sports betting, but also in some sociological fields in which he is interested. He has been in the world of the pool using computer technology ans statistics for more than 20 years and betting for about 12 years. He loves to bet and create strategies, not only in traditional bookmakers, but also in exchange houses. Great football and snooker fan.
For Betaminic it has been a pleasure to have the collaboration of Dani for this article, and we hope to enjoy his knowledge in future occasions.