In this article, we will try to explain the importance of Drawdown as an indicator of risk in sports betting strategies or systems. A lot of you will hear this term because you see it often in statistics or in different graphs of results, but we want to show you the different uses that can be given. One of the main objectives of this post is to serve as a reference to calculate what would be the optimal investment capital and stake, as well as another type of advantages that this variable, which is so unknown to many, can provide.
What is the Maximum Drawdown?
The first thing we are going to do is define the concept of Drawdown. As background, you should know that this term is widely used in the world of the Stock Exchange, and especially in the systems trading futures, options, etc.
This indicator measures the largest number of losses that have had historical results, in our case applied to a strategy or system. That is, it measures the difference between a maximum point and a minimum for a given period.
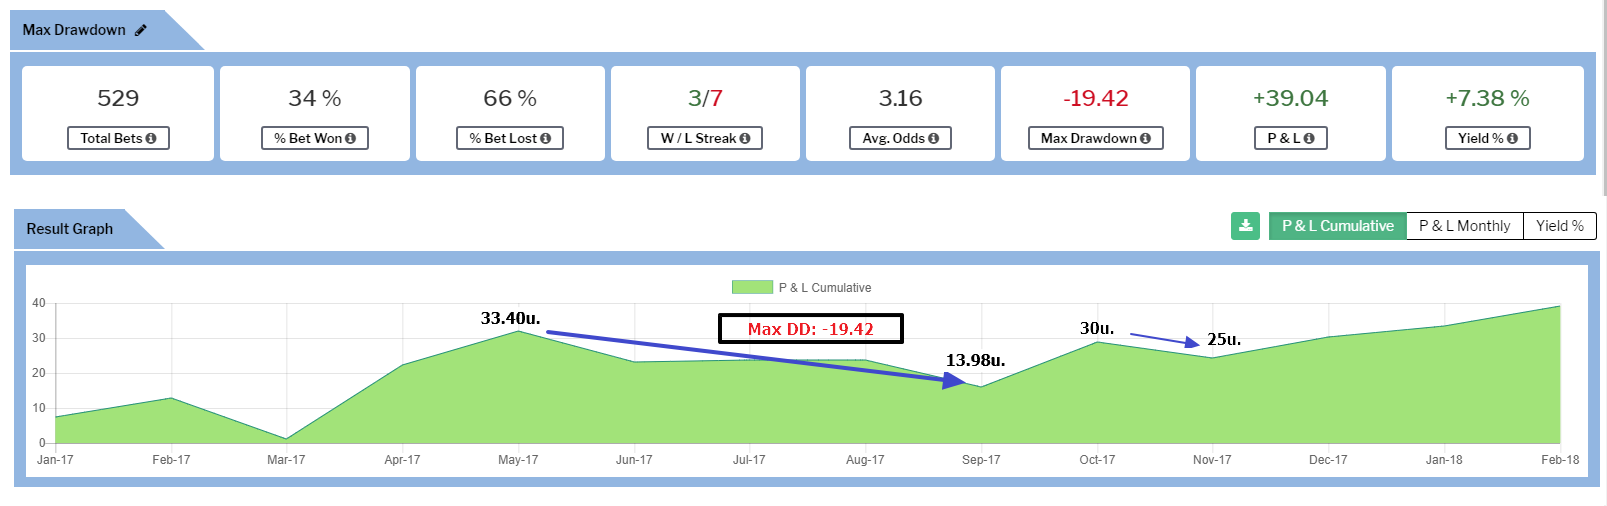
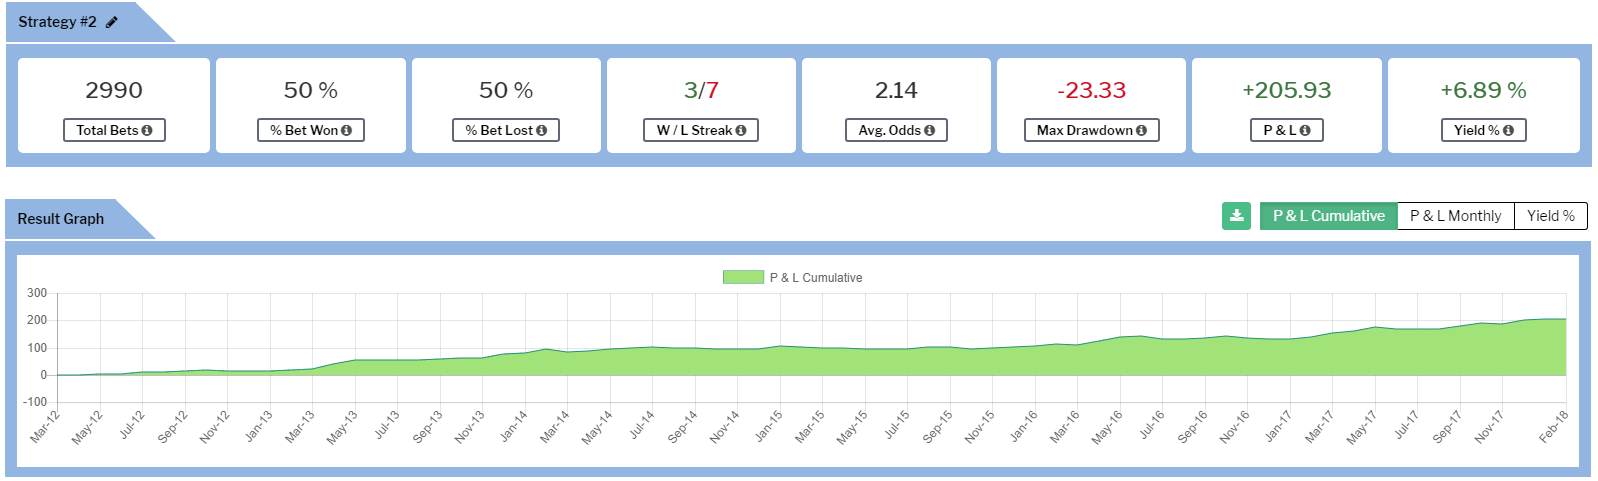
Let’s see it with an example so that it is much easier to understand. In this graph of results of a strategy created with the tool Betamin Builder, we see that the Max DD is -19.42u., Which is equivalent to the biggest negative streak of this strategy. From a peak, or maximum that was 33.40u. it drops to a minimum of 13.98u. From there it rises again, the next peak that would be about 30u. It descends until 25u., that would be another drawdown, but it does not reach the Max DD. previous.
Why is Max Drawdown so important?
Once you have seen how the drawdown is calculated, you will wonder if this concept is really so important for the analysis of the strategy, or it is simply a term that suits very well with the data, but that may not have greater significance. Well, let me tell you that from my point of view is the most useful indicator to evaluate the risk of a strategy. Think that this value represents with historical data the maximum amount that a punter could have lost following a certain strategy, or in other words, the worst streak that your bank or yourself as a bettor would be willing to lose.
When we analyze the results of a strategy the first thing that is usually checked is the profit as well as the corresponding Yield, but sometimes we do not pay much attention to Max Drawdown, or directly that data is not available. We recommend that if you follow a specific system or tipster, you demand that information in their statistics. Everyone is prepared to win; when a system is making a profit, everything goes well, but when you enter into a bad run of results the doubts come in, you distrust that strategy, or worse, you quit prematurely and in many cases, you leave without getting future profits.
The Max DD has to be an indicator of the maximum losses you are willing to face. If those accumulated losses are within the range of the DD Max analyzed, you do not have to worry about anything, you have to let the strategy move on. One of the advantages of following a strategy is to leave emotions aside, let the system work for you, and you only have to worry that the results are within the normal parameters of that strategy.
Let’s see an example of a strategy created with Betamin Builder so you can check for yourself the importance of Max Drawdown as a factor of analysis.
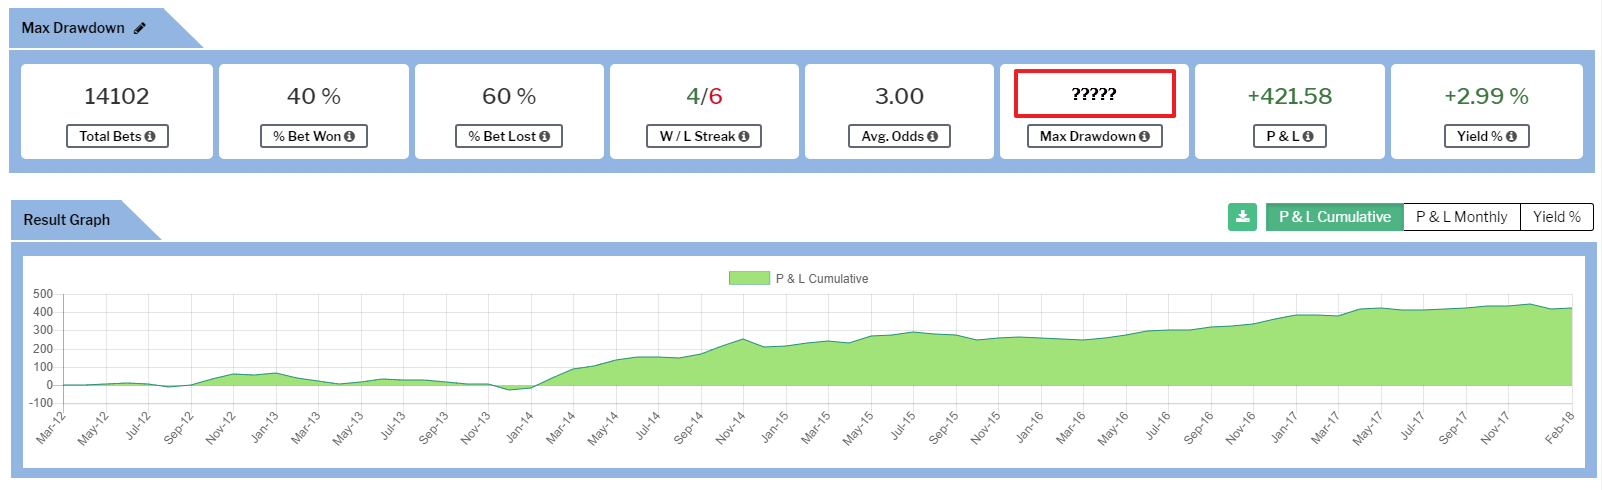
At first glance, and without knowing the Max DD, it seems a pretty good strategy. More than 400 units of profit and 3% of Yield with 14k picks. The first few years have had a flat profit, but since 2014 it has been increasing dramatically.
Now we get the data with the Max DD:
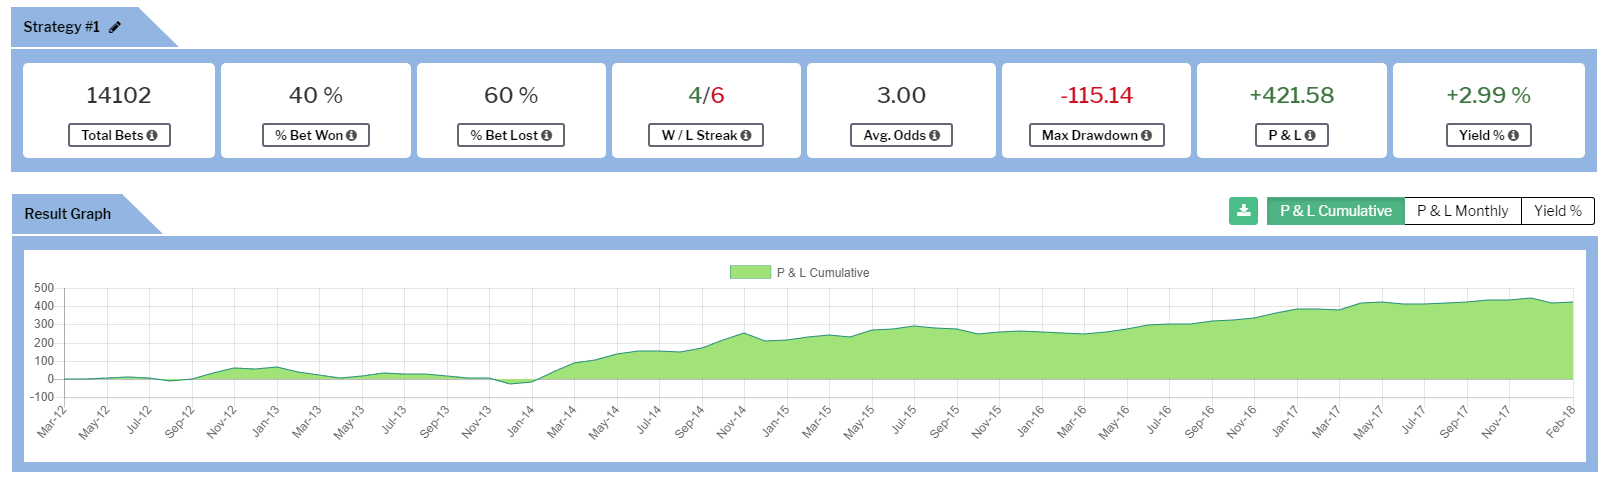
This strategy has a Max DD of 115 units of loss, but what does that data mean exactly? To give you an idea, and with the premise of having a system with a fixed stake of 10€ per pick, that punter should be willing to take a possible loss of -1,151.40€. In principle, I doubt very much that someone is capable of withstanding that amount of losses.
In the following strategy you can see that although the profits are lower and it might seem like a worse strategy, the Max DD seems much easier to support.
Criterion to establish a stop loss according to the Max DD
One of the premises that we must have clear is that the past results are not going to behave exactly the same in the future. When analyzing a strategy we study a series of factors that describe how it has worked in the past, and also help us to know if it could continue to be profitable in the future.
One of the complementary analyzes we perform is the Monte Carlo Simulation. We will explain that in a detailed article, but what we try to find are several random samples with the data of the picks of the strategy in question to see the behavior that is obtained. Said in a simpler way and with a very clear example, in the case of Max Drawdown it is about seeing what results are obtained if the date of each pick is changed randomly.
To simplify this process, we will establish a stop-loss in the strategies when the Max DD of the original strategy, that is, when it is made public, is exceeded by 50%, regardless of the result of the strategy at that moment. (which could be positive), as it is indicated in our FAQs. For example, if at the time of launching a public strategy it has a Max DD of -30u and at some point, it reaches -45u., that strategy is no longer followed, to protect the capital of our users.
As we always recommend, it is better that you have several strategies to minimize the total risk. You can use the Betamin Builder aggregator to calculate the Max DD of the aggregate strategies. In this case, the stop-loss would be determined by the Max DD resulting from the aggregate strategy as such.
Setting a stop loss to a strategy or set of strategies is vital so as not to sacrifice our capital as punters. If a strategy is working within the “normal” intervals analyzed, the user should let the system work by itself, trying to avoid the emotional factor, especially when someone is facing a negative streak. The bettor should act equal to the streaks, both good and bad. If the streak is bad, you do not have to question if that strategy has stopped working and lose confidence in the system. One of the main causes, why people do not win long term, is to abandon a system when there are losses because most of the time the variance acts and the bad streaks become good.
In this article you will find different ways to calculate a stop-loss depending on your level of risk.
How to adjust the stake according to the Max DD?
As most of you know, all the public strategies we have, as well as those created by the users, have a flat stake of a unit. However, what we advise is that you adapt your stake to Max DD.
As we have explained previously, we recommend setting the stop-loss as a rule when the Max DD of the original strategy is exceeded by 50%. Of course, this criterion may be different for each punter, perhaps many prefer to set a stop-loss simply when the Max DD of the strategy is exceeded. In any case, the important thing is that once you have decided the stop loss criteria you can adjust your stake according to the capital that you have available.
We can see it with an example so that it can be used as a guide:
- Bank available for one or several strategies, 1000u. (These units are equivalent to each one’s currency, euros, pounds, etc.). We refer to the bank or capital exclusively for one or several systems, which is independent of the total bank that each one has for betting.
- Stop-loss: for this example, we assume that it is -30u.
- Stake: the maximum stake that should be applied to each bet is 33u. (1000/30), but we recommend that you start with a much lower stake, and raise it gradually as you get profits.
Conclusions
- The Max Drawdown is one of the best indicators to assess the risk of a strategy or set of strategies.
- It helps you calculate the stake you have to apply to each bet, depending on the available bank.
- It is very useful to set the stop-loss. We advise putting a stop loss based on the calculated Max DD, in our case we do it when it is over 50%, but each bettor can decide how to set it.
- The Max Drawdown with historical data is difficult to replicate accurately in the future, so it is advisable to complement it with another type of analysis, such as the Monte Carlo Simulation. To make it easier for everyone, a possible alternative is to add a margin as the maximum limit of losses to be assumed.
- It lets you know in a bad streak if the results are behaving within the normal values previously analyzed.
This is all. Hopefully, you have found this article useful, if so, then we would appreciate it if you shared this article via social media through the share buttons that you will find at the top or bottom of this post.
If you want us to write about a particular topic, you can email us to su*****@be*******.com, and we will study it in detail.
Comments 0
fabinhomengao
October 29, 2021Amazing article.