In this guide, you will find all the necessary steps to learn how this amazing sports statistics tool works that will help you improve your betting results.
1. Main filters of the tool
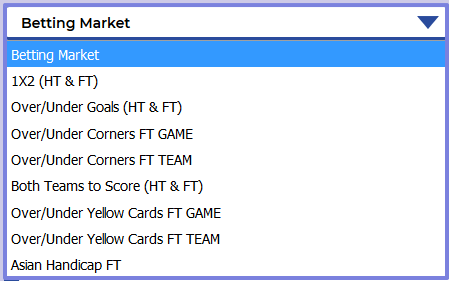
The first thing you should do is select the main filters, such as the betting market and betting type. By default, 1X2 (HT & FT) and 1X2 FT are selected, but you can change the market if you wish. There are 8 betting markets available.
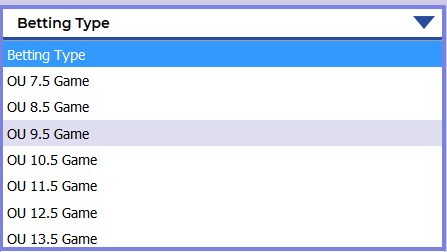
Depending on the selected betting market, you can choose a different betting type. For example, if you select the Over/Under Corners GAME, you can choose between Over/Under 7.5 and Over/Under 13.5 corners.
2. Select the rest of Filters
2.1 League Filter
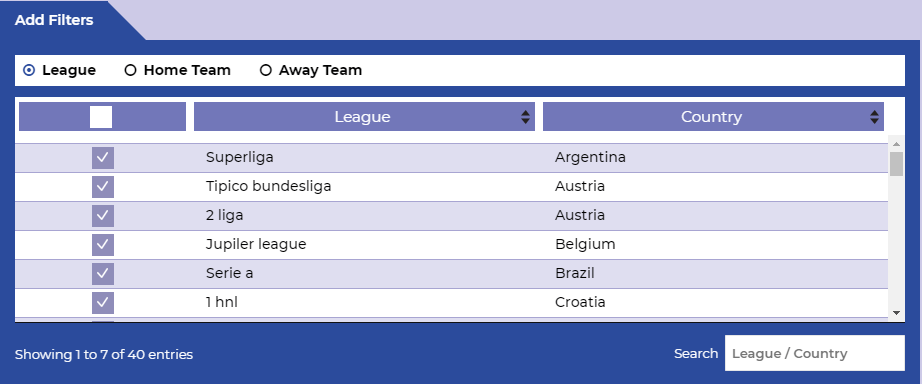
You can choose the leagues you want from a total of 50 leagues that we have available to you. To help you in the selection, you have the option to search, as well as sort by league or country to make the process faster and more efficient.
2.2 Home Team and Away Team Filters
You can choose different options among these three subfilters:
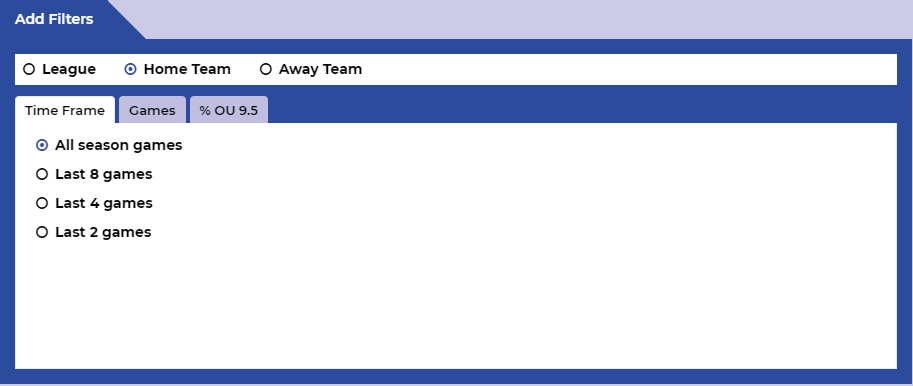
2.2.1 Time Frame
You have at your disposal up to 4 different types of periods to choose to quickly identify the trends of teams, both short and long-term. These periods are always calculated on the same season. In case a team has not played a minimum number of matches based on the selected trend, the matches will not be shown in the results. For example, if a team has only played 7 matches in its league and the filter of the last 8 games is selected, the match of that team in question will not be shown in the results.
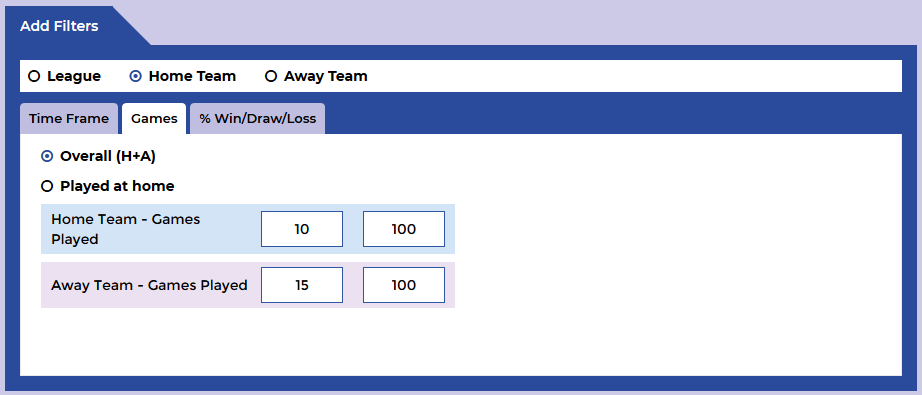
2.2.2 Games
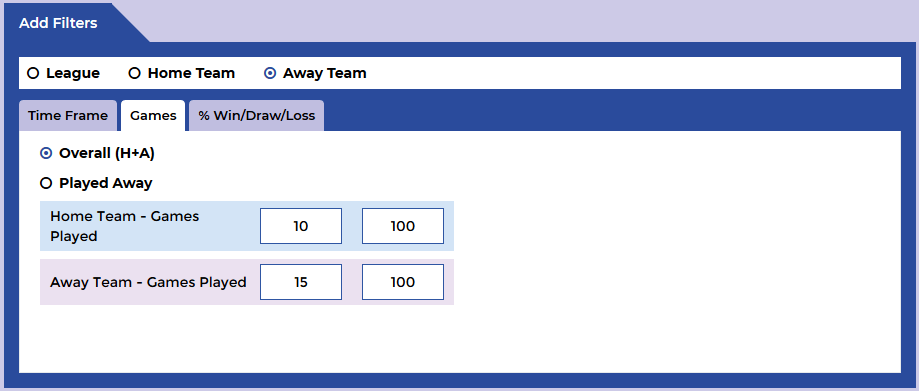
To perform your analysis you have two options, you can select all the matches of a team, that is, both those who have played at home and away, or only those who played at home for the home team or away for the away team. You can also select the number of games played by each team to perform more precise searches. This is very important depending on the type of trend you want to look for. For example, it is very useful for different trends to take account the weight playing at home with their own fans or the opposite, thinking of teams that have good performance away.
Home Team:
Away Team:
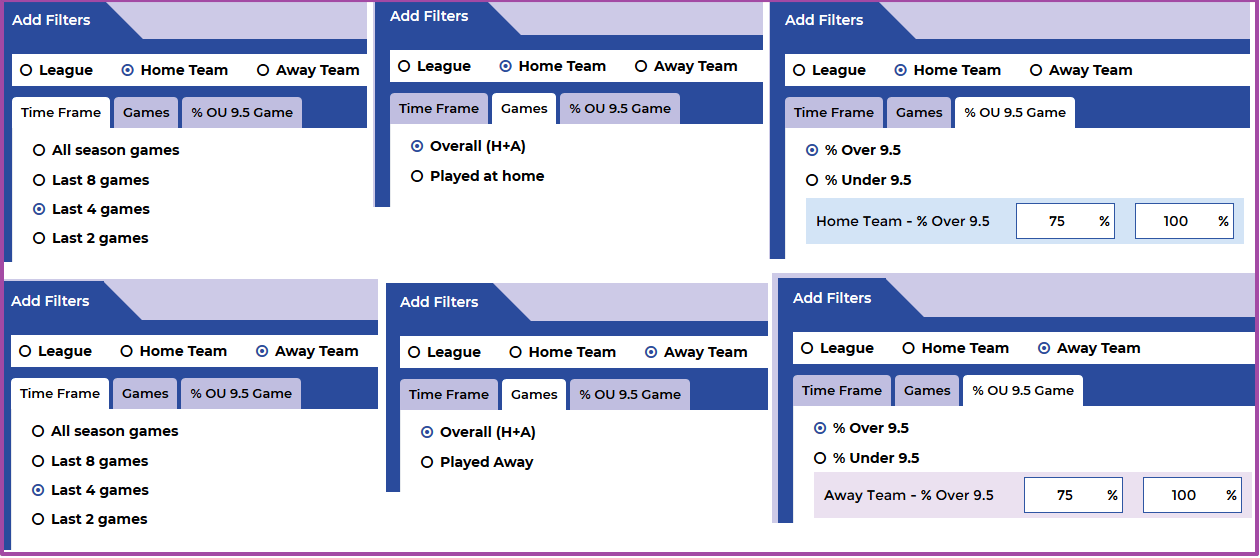
2.2.3 Percentages
In this section, you can filter by the percentage depending on the betting type previously selected, both for the home and away team. This powerful filter will allow you to find those matches that meet the established percentage conditions. It is very useful to obtain results with a maximum degree of accuracy and that will allow you to find very difficult trends to identify without this type of tools. For example, you can look for those matches where the home team comes from a good run of results and the away team has a losing streak. You can also look for games where both teams have a specific percentage of overs or unders in corners, goals, Asian handicap, etc. The limit is up to you!
In this example, we look for those matches where the home team and the visiting team have a percentage equal to or greater than 75% above the line of Over 9.5 corners, that is, 3 of the last 4 matches of both teams have finished above that line.

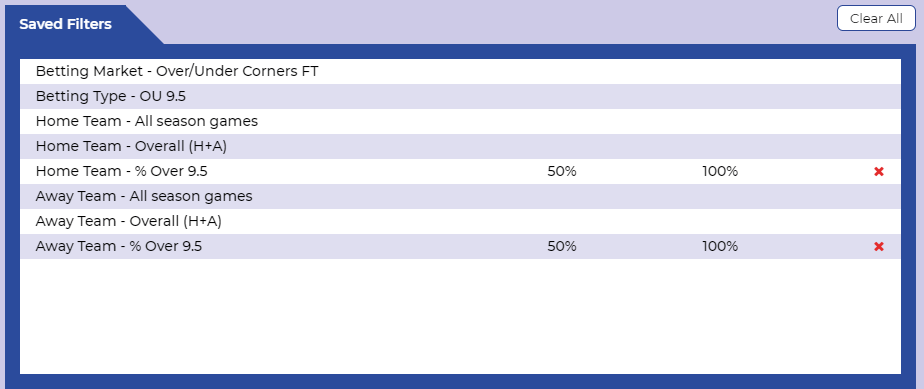
3. Saved Filters
As you create the filters, on the right side of your screen you can see the filters that are saved with the conditions of each of them. In this way, you will have a very clear vision of all the details. To modify the filters you have to do it from the section on the left, “Add Filters”. You can remove the percentages filters by clicking on the x icon.
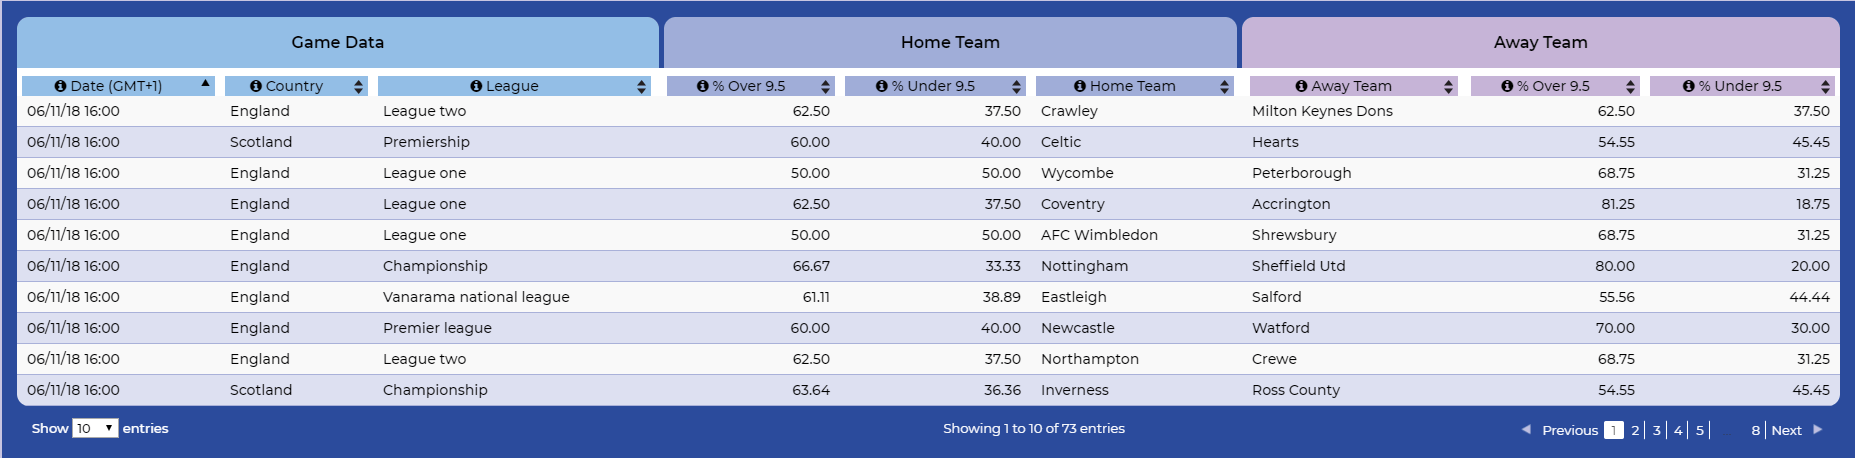
4. Results
At the bottom of the screen, you will see the next matches that meet the conditions you have set in each of your filters. In this section, you will find three totally different parts, such as the general data of the match, date, country and league, and then the results of the home and team, depending on the selected market and betting type, as well as the conditions you have indicated in the previous filters. The results are totally dynamic and are updated instantly, every time you modify any filter. You will always be able to display the results of the matches with up to 7 days of the start of the same. In case you do not get any results, it’s mainly because there are no matches in the next 7 days that meet your filters. Also, in each column, you have a small help with a brief explanation of each of the fields.
All the fields can be sorted to facilitate the search. The numeric fields correspond to the percentage of each filter. For example, in the column % More 9.5 of the Home Team, the value 50.00 indicates that the home team has finished 50% of its games with more than 9.5 corners, and according to the conditions of your filters, played only at home or overall, the last 2, 4, 8 games, or the whole season, etc.
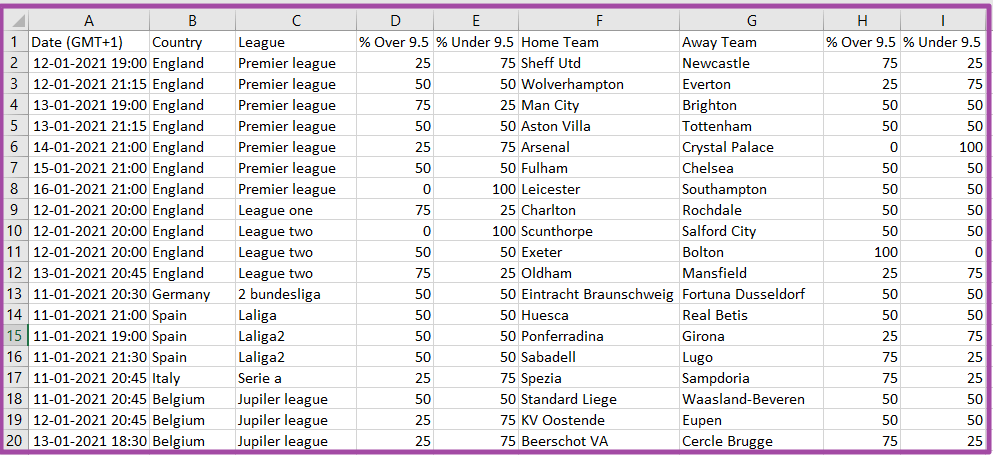
5. Download to Excel
On the top of the page, you will find a button to export the results to Excel. In this way, it will be much easier to analyze the matches according to the filters you have set. The data exported are the next games found with the conditions established by you, that is, the same results that you can see in the tool, and thus you can study in a more efficient way the results obtained, or keep the results for a later analysis.

6. Get email alerts
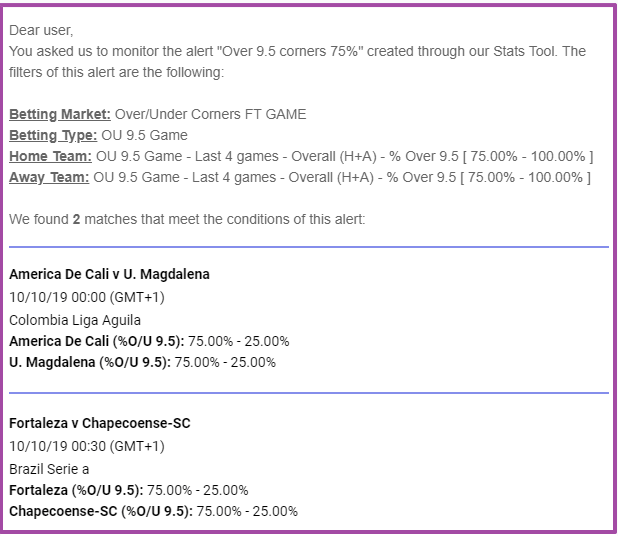
The great advantage of this tool is that you can save the alerts once the filters are selected and receive the results in a comfortable way by email. You will gain in efficiency, and you will save time by looking for the statistics on different pages and then write down the results in a manual way. When you create an alert, you will receive matches that meet the conditions of the filters in your email inbox. It is a way to optimize your time since you will save yourself the fact of searching daily for information on different websites.
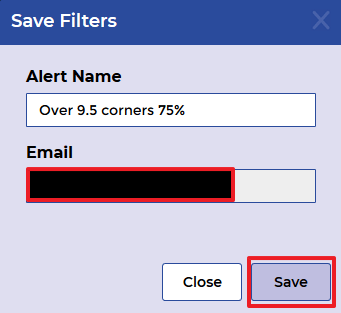
You only have to indicate the name of the alert and it will be sent to the email address with which you have registered. We advise you to give a name that allows you to identify in a simple way the results that you will receive. Do not worry, because in the email in addition to the name of the alert, you will be able to see the detail of all the filters included in the alert. For example, if the name of the alert is “Teams with a good scoring streak in the last 4 matches” it will always be easier to identify that alert than if you name it for example “Alert 1”.
To save an alert, click on the “Receive email alerts” button.
*** If you cannot find the email, check your spam folder.
![]()
Thus, whenever there are upcoming matches to play that meet the conditions of the alert you will receive an email with details of the games.
7. Betting Markets
7.1 1×2 (HT & FT)
1X2 is the main market used in football betting. Represents the result obtained after 90 minutes of a football game. It includes the possible injury time of the match, but it doesn’t include overtime or penalties. 1X2 HT takes into account the result obtained during the first half of the game.
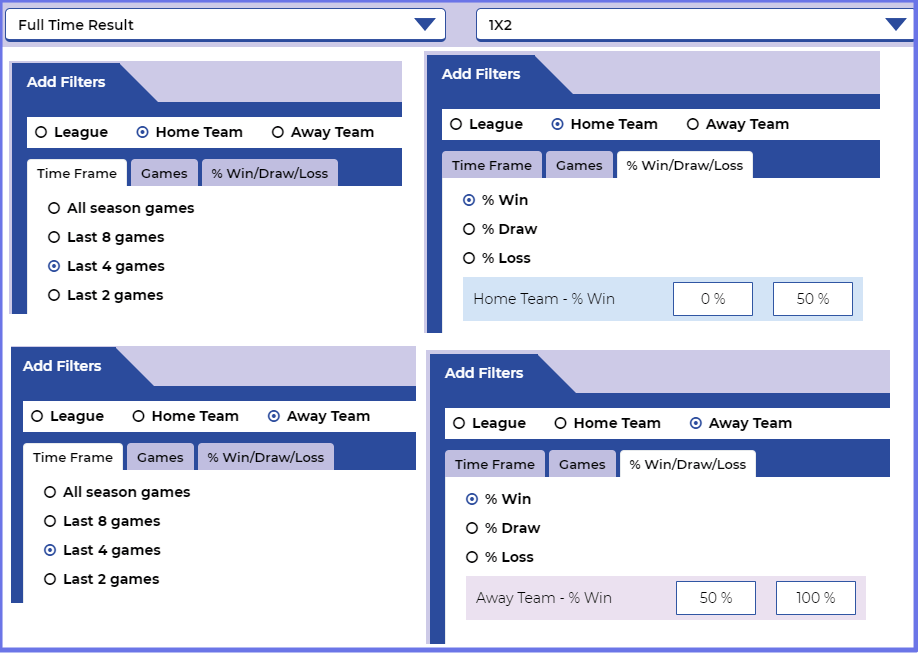
In the tool you can select the percentage of Wins, Draws or Defeats of each team to configure your alert, both for the Home and Away Team. In this way, you can build a wide variety of alerts to identify all kinds of trends.
Example
An example of an alert may be finding those matches where the away team comes from a very good run of results (has won at least half of the last 4 games) and the home team has not won more than half of their last 4 games.
- Betting Market: 1X2 (HT &FT)
- Betting Type: 1X2 FT
- Home Team: 1X2 – Last 4 games – Overall (H+A) – % Win [ 0% – 50% ]
- Away Team: 1X2 – Last 4 games – Overall (H+A) – % Win [ 50% – 100% ]
7.2 Over/Under Goals (HT & FT)
This filter represents the market over the total of goals in a match or in the first half. The bet is won if the match ends with more or fewer goals than the selected line. In this table, you can see the result of the bet according to the number of total goals.
It shows the percentage of matches of the home or away team finished over or under a certain line. It is a very useful filter to see the scoring trend of the teams, both short and long-term. You can look for matches where both teams come from games with many goals or otherwise, games with a high number of unders.
Example
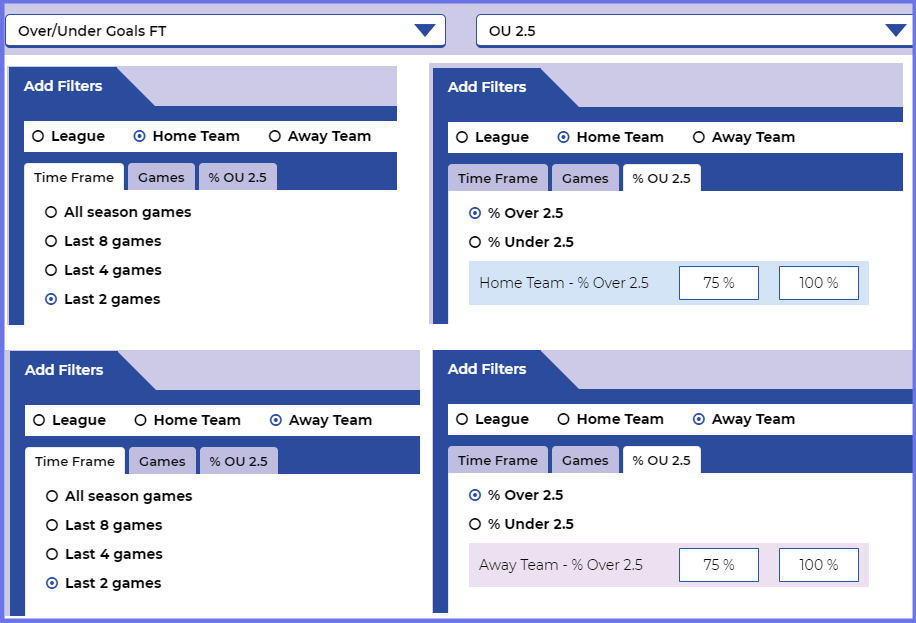
In this alert, we look for those matches where the home team has finished its last two games with a minimum of 75% of matches with over 2.5 and where the away team has at least 75% of over 2.5 in their last 2 games as well.
- Betting Market: Over/Under Goals (HT &FT)
- Betting Type: OU 2.5 FT
- Home Team: OU 2.5 – Last 2 games – Overall (H+A) – % Over 2.5 [ 75% – 100% ]
- Away Team: OU 2.5 – Last 2 games – Overall (H+A) – % Over 2.5 [ 75% – 100% ]
7.3 Over/Under Corners FT GAME
It indicates the percentage of matches that are over or under a certain line of corners, taking into account the sum of the corners of both teams. This filter is very useful to find the streaks that the teams have in certain lines of corner kicks depending on the period of time analyzed.
You can see in a simple way the percentage of matches that have finished over or under a certain number of corners and it will be of great help to identify the trend that each team has.
Example
In this case, an alert that we have been following for some time with good results is to continue the trend of Over 9.5 corners in the last 4 matches. We look for those games where the home team and the away team have a percentage equal to or greater than 75% above the line of Over 9.5 corners, that is, 3 of the last 4 matches of both teams have finished above that line.
- Betting Market: Over/Under Corners FT GAME
- Betting Type: OU 9.5 Game
- Home Team: OU 9.5 – Last 4 games – Overall (H+A) – % Over 9.5 [ 75% – 100% ]
- Away Team: OU 9.5 – Last 4 games – Overall (H+A) – % Over 9.5 [ 75% – 100% ]

7.4 Over/Under Corners FT TEAM
Indicates the percentage of games where the home team or the visitor has taken more or less corner kicks, according to the particular line of corner kicks selected. This filter is based on the number of corners per team, unlike the previous filter, which takes into account the corners per game.
Example
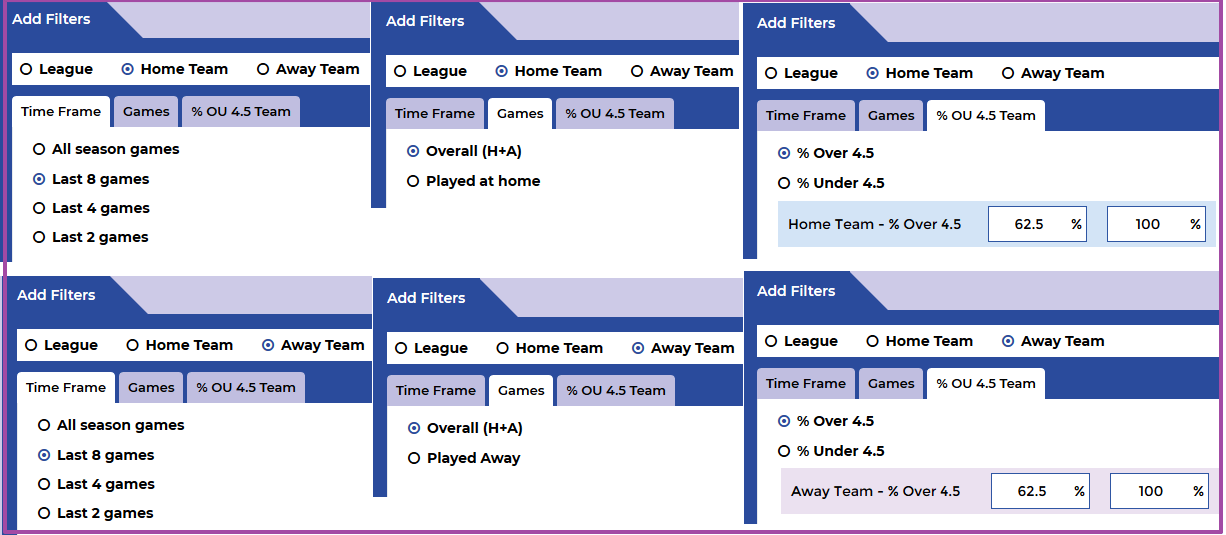
In this case, we are looking for a high percentage of corners that each team has in the line of Over 4.5 corners. Where at least 5 of the last 8 both teams took more than 4 corner kicks, that is, 62.5%.
- Betting Market: Over/Under Corners FT TEAM
- Betting Type: OU 4.5 Game Team
- Home Team: OU 4.5 – Last 8 games – Overall (H+A) – % Over 4.5 [ 62.5% – 100% ]
- Away Team: OU 4.5 – Last 8 games – Overall (H+A) – % Over 945 [62.5% – 100% ]
![]()
7.5 Both Teams to Score (HT & FT)
It is a betting market used more and more frequently by punters, both for half time and full time.
There are two types of bets:
- BTTS Yes. The bet is won if the two teams score at least one goal during game time.
- BTTS No. The bet is won if at least one of the two teams does not score during game time.
With our tool, you will find it very easy to find the conditions that you establish in the filters since otherwise, it will be an important manual effort collecting and analyzing this type of information.
Example
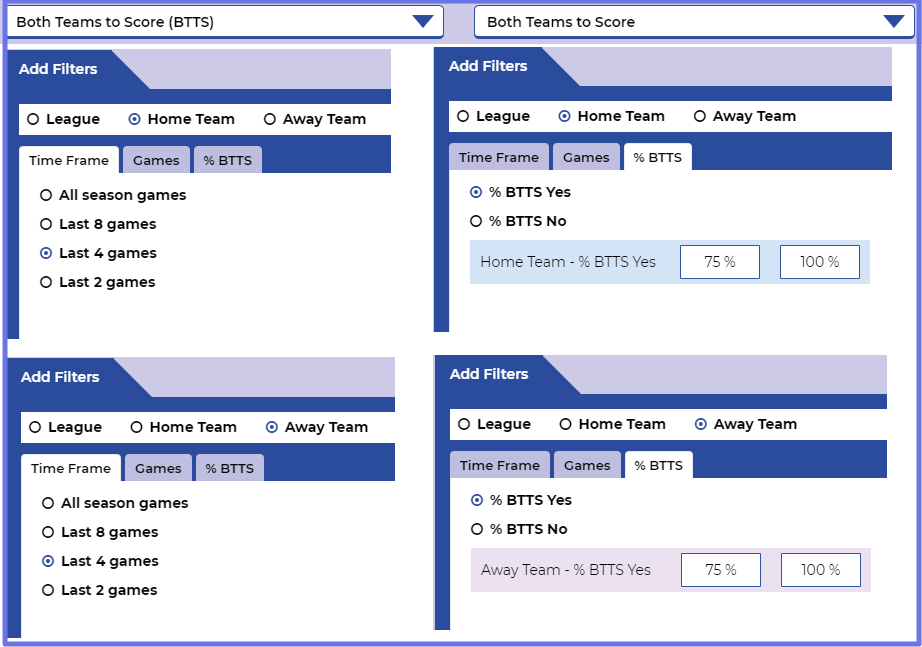
We will create an alert where we identify those teams with a high percentage of matches that end with the option “BTTS Yes”. We look for the home teams whose last 4 games have a percentage of at least 75% of matches that both teams have scored, and we also select the same condition for the away team.
- Betting Market: Both Teams to Score (HT & FT)
- Betting Type: Both Teams to Score FT
- Home Team: Both Teams to Score FT – Last 4 games – Overall (H+A) – % BTTS Yes [ 75% – 100% ]
- Away Team: Both Teams to Score FT – Last 4 games – Overall (H+A) – % BTTS Yes [ 75% – 100% ]
7.6 Over/Under Corners Yellow Cards GAME
The total number of yellow cards received in a game is taken into account, that is, the sum of the cards of the home team and the visitor. Two yellow cards are counted as two cards, and a direct red card is counted as zero yellow cards.
Example
We will create an alert where more than 3 cards have been received in the last 4 games, that is, in 100% of the matches.
- Betting Market: Over/Under Yellow Cards FT GAME
- Betting Type: OU 3.5 Game
- Home Team: OU 3.5 – Last 4 games – Overall (H+A) – % Over 4.5 [ 100% – 100% ]
- Away Team: OU 3.5 – Last 4 games – Overall (H+A) – % Over 4.5 [ 100% – 100% ]

7.7 Over/Under Corners Yellow Cards TEAM
It is calculated based on the yellow cards a team has received. Two yellow cards are counted as two cards, and a direct red card is counted as zero yellow cards.
Example
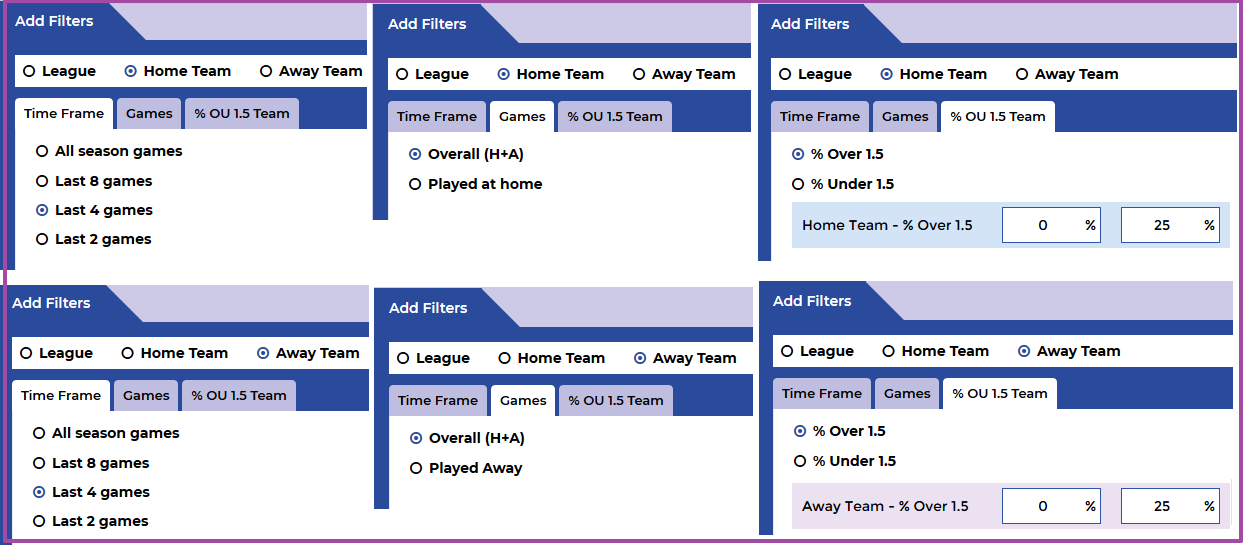
We will create an alert where few cards have been received per team in the last 4 games.
- Betting Market: Over/Under Yellow Cards FT TEAM
- Betting Type: OU 1.5 Team
- Home Team: OU 1.5 – Last 4 games – Overall (H+A) – % Over 1.5 [ 0% – 25% ]
- Away Team: OU 1.5 – Last 4 games – Overall (H+A) – % Over 1.5 [ 0% – 25% ]
7.8 Asian Handicap
Asian Handicap is a football betting market very popular in Asia, hence its name. It means that a team receives an advantage or disadvantage in the form of a handicap before the match begins. That is, if a team has a Handicap of AH +1.0 it means that the bet would be won if the game ends at least in a draw, if the team loses by one goal the bet would be returned, since it would “cancel” that given initial advantage, and if lose by more than one goal the bet would be lost. At first, it may be a little complex to understand if this betting market has never been used, but over time it becomes easier and is done almost automatically. Do not worry if you find it a little complicated until you become familiar with this market.
In the tool, you will be able to analyze and identify trends for the AH in a completely simple and fast way. You can access the percentages of the different types of AH that have been won, lost or voided (if this is the case) for the teams.
Example
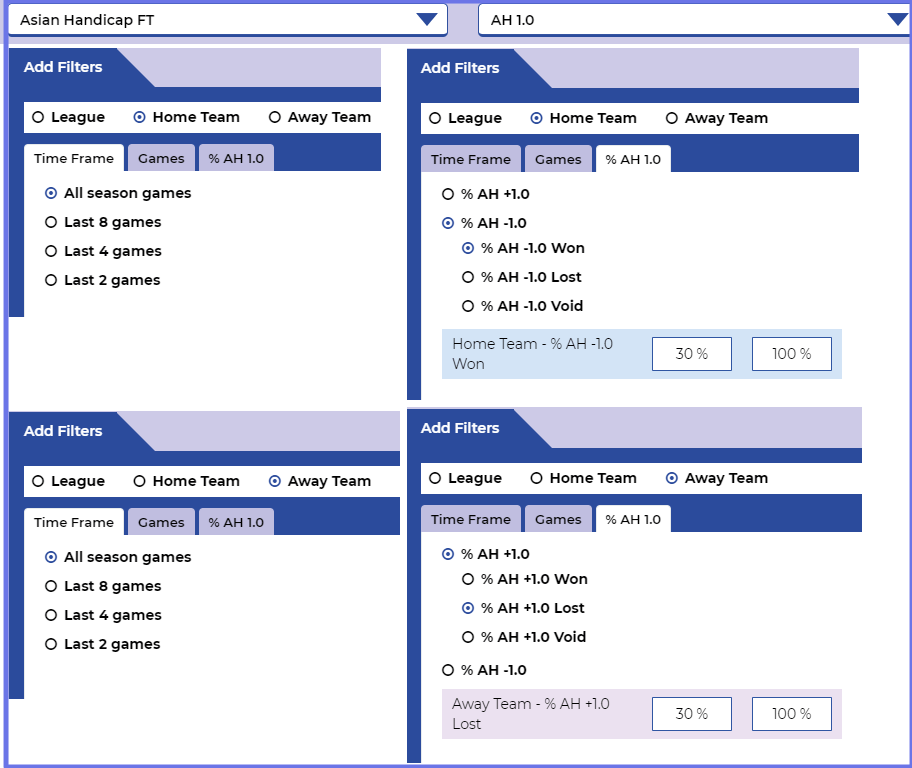
It is easier to see it with a specific example. In this case, we will search matches where the home team has a run of at least 30% of AH-1.0 won in all games of the season and the away team has a negative streak of at least 30% of AH + 1.0 also lost in all matches. That is to say, the home team has won at least 30% of the matches with more than 1 goal difference and the away team has lost at least 30% of the matches with a goal of advantage given by the AH.
- Betting Market: Asian Handicap FT
- Betting Type: AH 1.0
- Home Team: AH 1.0 – All season games – Overall (H+A) – % AH -1.0 Won [ 30% – 100% ]
- Away Team: AH 1.0 – All season games – Overall (H+A) – % AH +1.0 Lost [ 30% – 100% ]
If you want us to explain any of the sections in more detail or think that some help is missing for certain sections of the tool, please send us a message to su*****@*******ic.com or through our contact form.