What are the best Betaminic strategies to start with?
Betamin Builder Starter Guide
The Betamin Builder is an amazing backtesting tool.
You can see in an instant how a betting strategy performed when its filters are applied to historical data from 111 leagues going back to 2012. While past results do not guarantee future profits, if we know which strategies worked in the past, then we have a good starting point for our betting system.
The best place to start is on the “Public Strategies” page in the Betamin Builder.
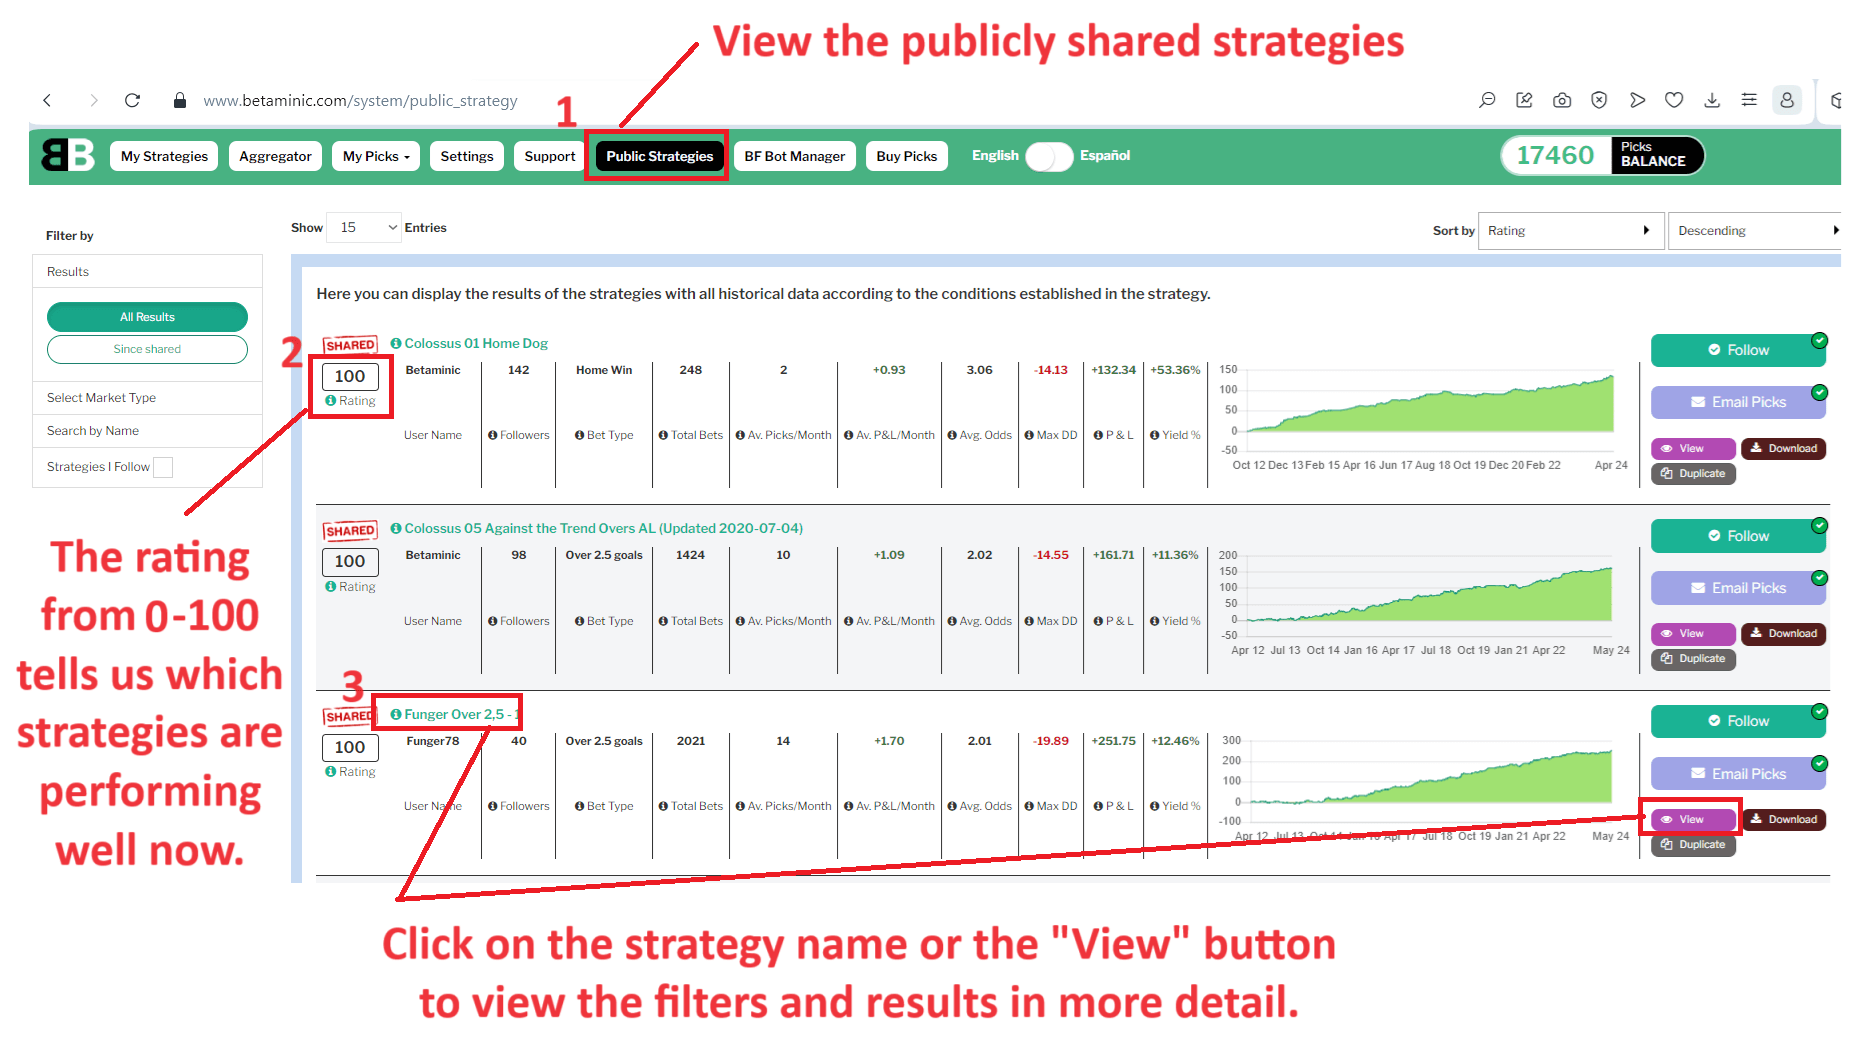
- Click on “Public Strategies” to see all the strategies that have been shared by users and also the Betaminic team.
- The rating value on the left of each strategy is a great way to see which strategies are performing well now and are worth taking a closer look at. Ratings are from 0 to 100 with 100 being the best. The rating is an indication that the strategy is in profit since it was shared and how likely its results are not due to luck but based on a value trend.
- Click on the strategy name or the “View” button to see more detailed information about the strategy.
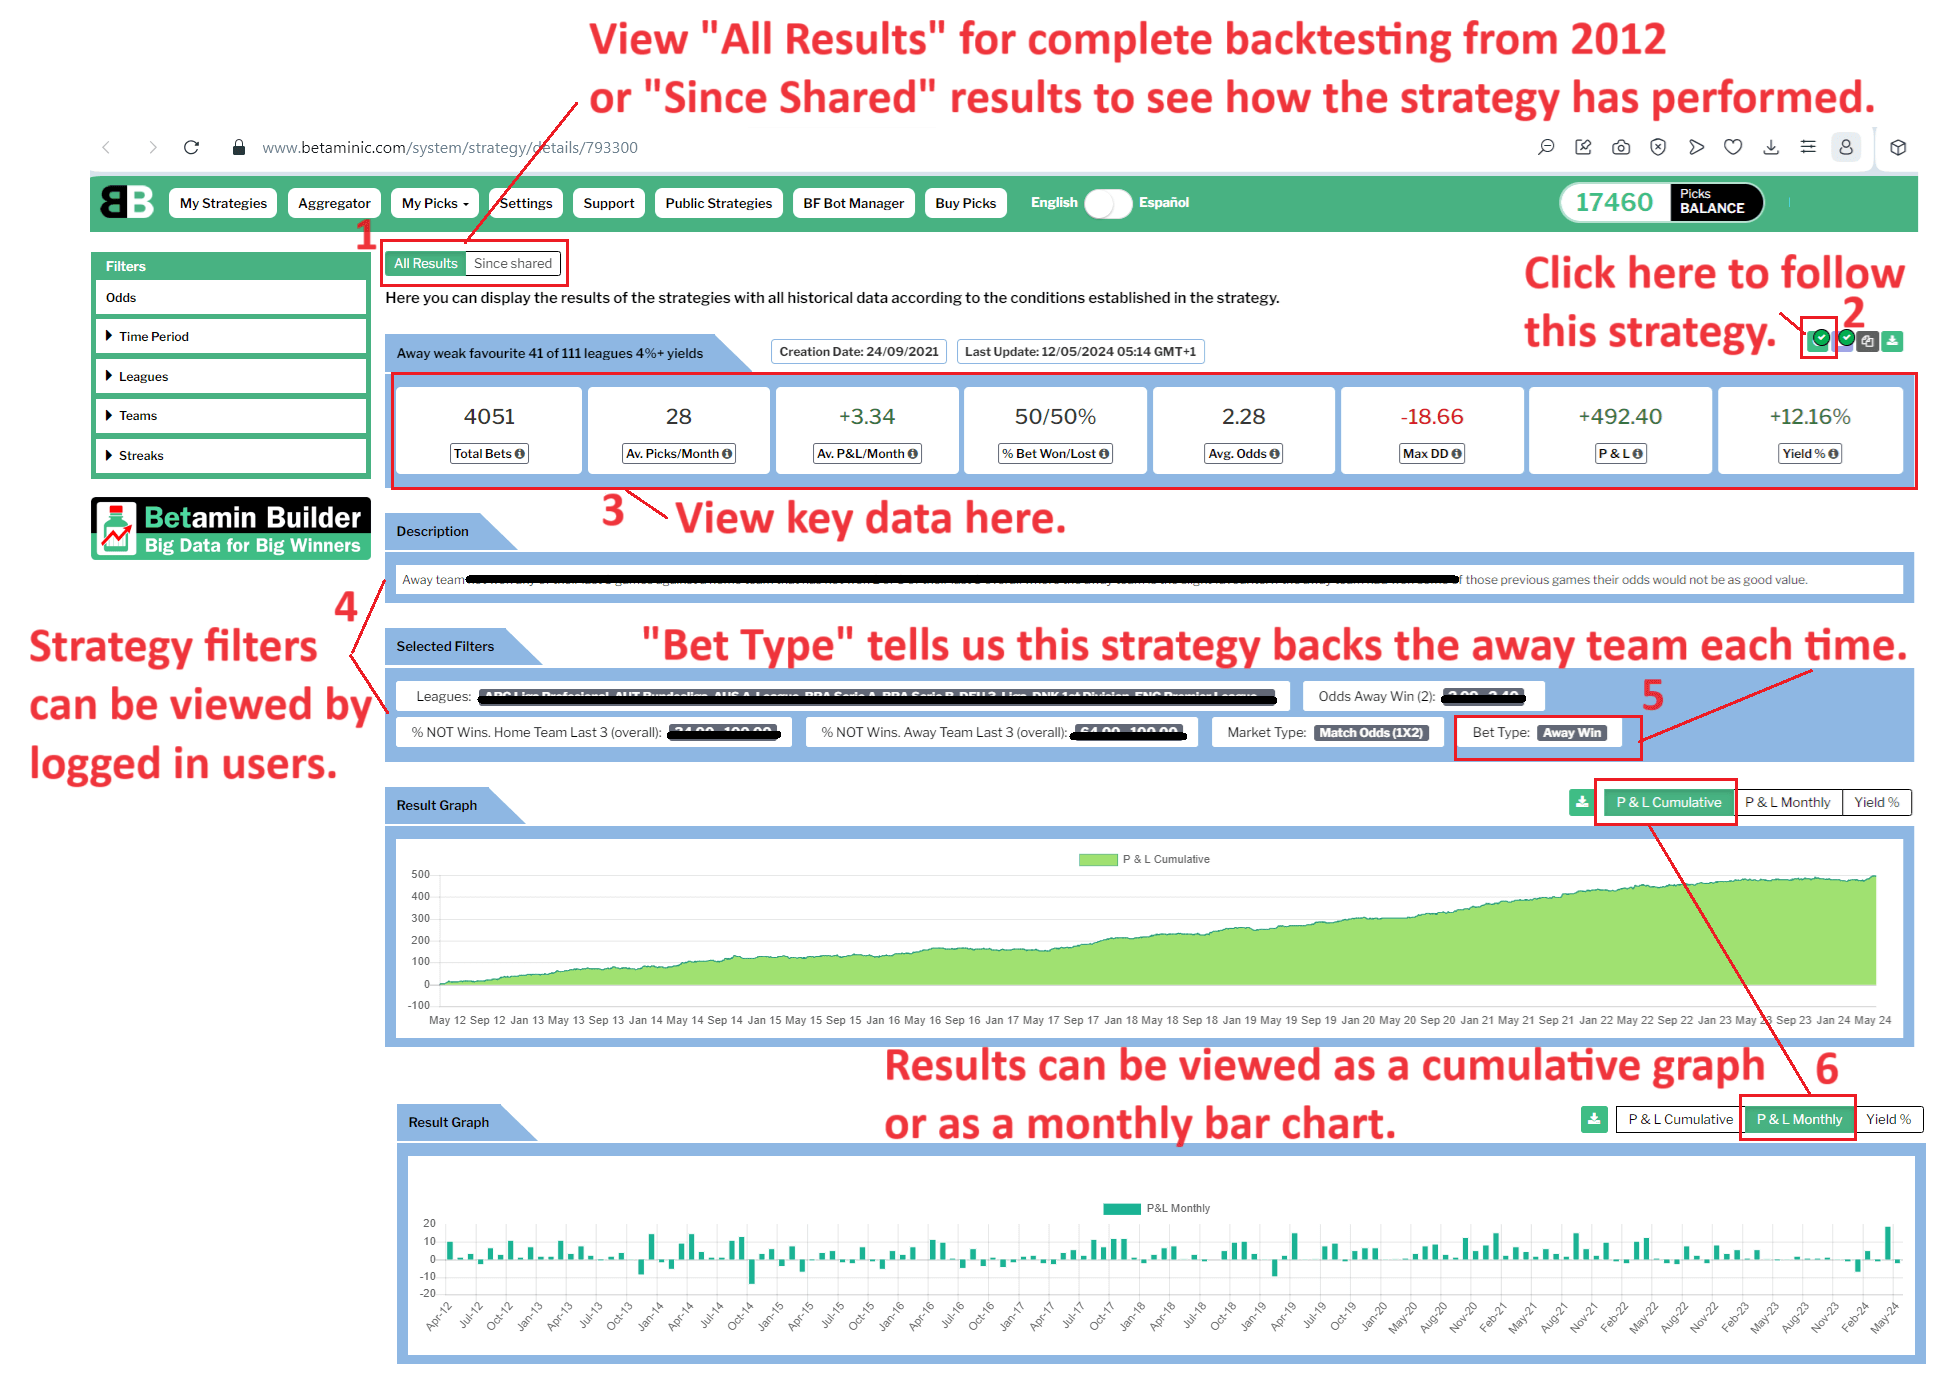
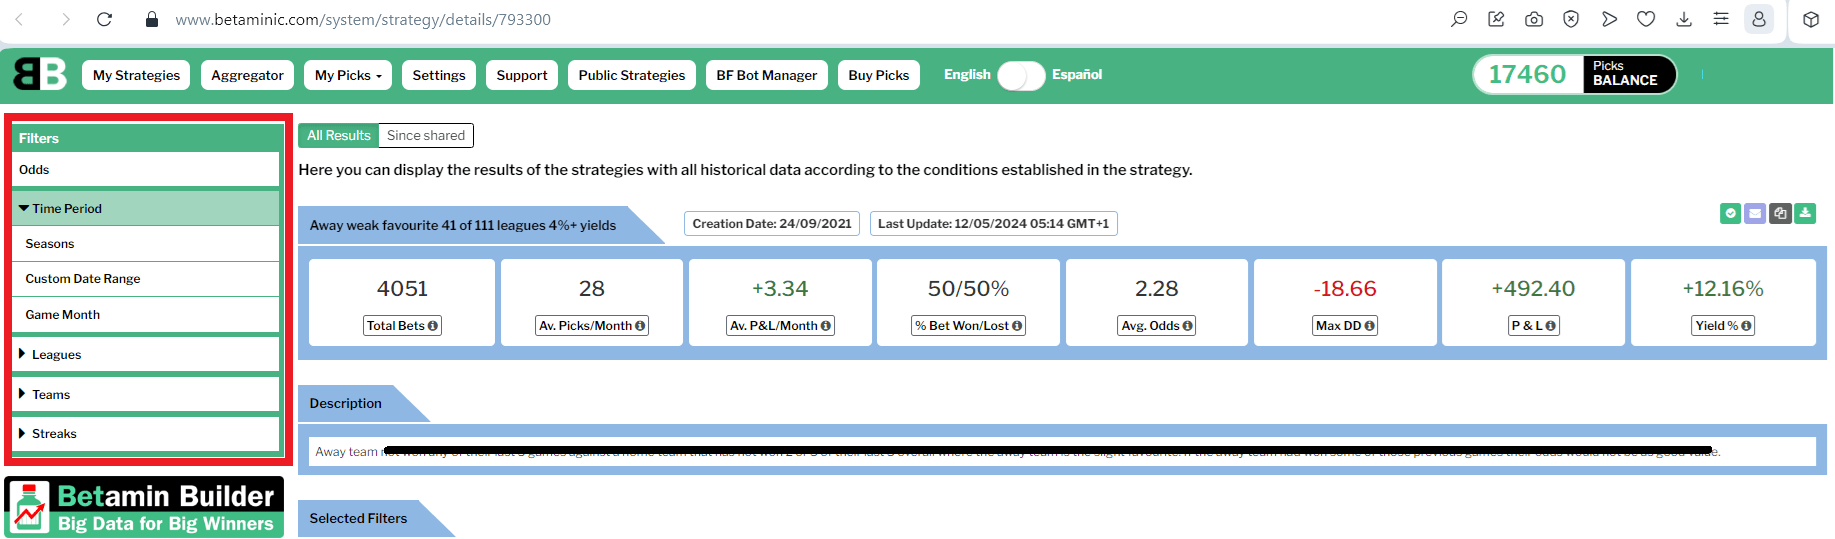
- You can view the “All Results” for complete backtesting to 2012. You can also view the “Since shared” results which only show the new data from after the strategy was shared. In this way we can see how the strategy performed after it was researched. Very importantly, we can see if the trend that was researched continued or not.
- You can follow this strategy by clicking on the green tick mark.
- You can see the important data at the top.
-
- Total bets tells us how many selections were found during the selected period. The more data there is, the more confident we can be about the results.
- Average picks per month. This gives us an idea about the volume of bets this strategy is likely to generate each month. Since the Betamin Builder works on a pay-per-pick model, the picks per month gives you an idea of the average monthly cost to follow this strategy.
- Average points per month. This tells us how much profit this strategy generated on average in backtesting. It does not guarantee future results, but it gives us a profit target to plan with.
- Win rate. This tells us about the character of this strategy. Is it likely to be mostly winners, or waiting for high priced underdogs.
- Average odds. Similar to the win rate, it tells us the nature of the strategy. Is it a low odds favorite follower, a 50-50 evens bet or a high odds underdog trend.
- The maximum drawdown tells us the biggest losing streak this strategy has had in backtesting. This is very important to know if this is a high or low volatility strategy and helps us plan our bank management.
- Profit and Loss. This tells us the backtested historical profit of this strategy.
- Yield. This tells us the backtested historical ROI (Return On Investment) of this strategy.
Strategy Icons
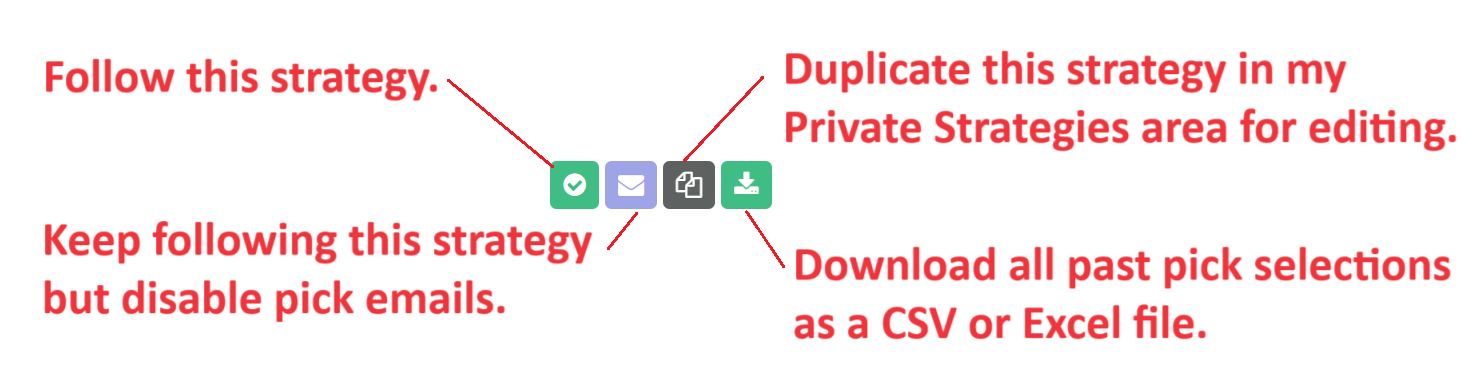
The 4 icons allow you to:
Follow the strategy. This will enable future picks for this strategy to be sent to your “Pending Picks” page, to your email and to your Bf Bot Manager software if you request that link to be setup. Each pick sent will result in one pick being deducted from your “Pick Balance”. Picks can only be sent if you have a positive pick balance. Picks can be purchased as a pack from the “Buy Picks” page. If you only want to receive picks to your Pending Picks page and/or Bf Bot Manager software, then you can click on the purple email icon to disable/enable the sending of new picks by email.
The duplicate strategy button allows you to copy this strategy’s settings and recreate it in your “Private Strategies” area. This will allow you to edit it and perform other manipulation and analysis of it. This is a good way to use the filters on the left menu to see how a strategy performs in different Time Periods such as season by season or in the last 5 years, etc.
The download icon will let you download all past selections as a CSV or Excel file for analysis, such as for staking analysis with tools like The Staking Machine.
What are the best Betaminic strategies to start with?
With so much choice of public strategies, it can be hard to know at the beginning which strategies to start with.
Betaminic is first and foremost a data provider. The Betamin Builder database is meant to enable users to make decisions themselves with all the data at their disposal. It is up to you, the user, to look at the top performing strategies and choose the ones that match your betting style and risk levels. Many users either follow existing public strategies or duplicate them and follow edited versions of them. Some users create their own strategies from scratch in the “My Strategies” area. We strongly encourage users to make their own decisions about which strategies to follow.
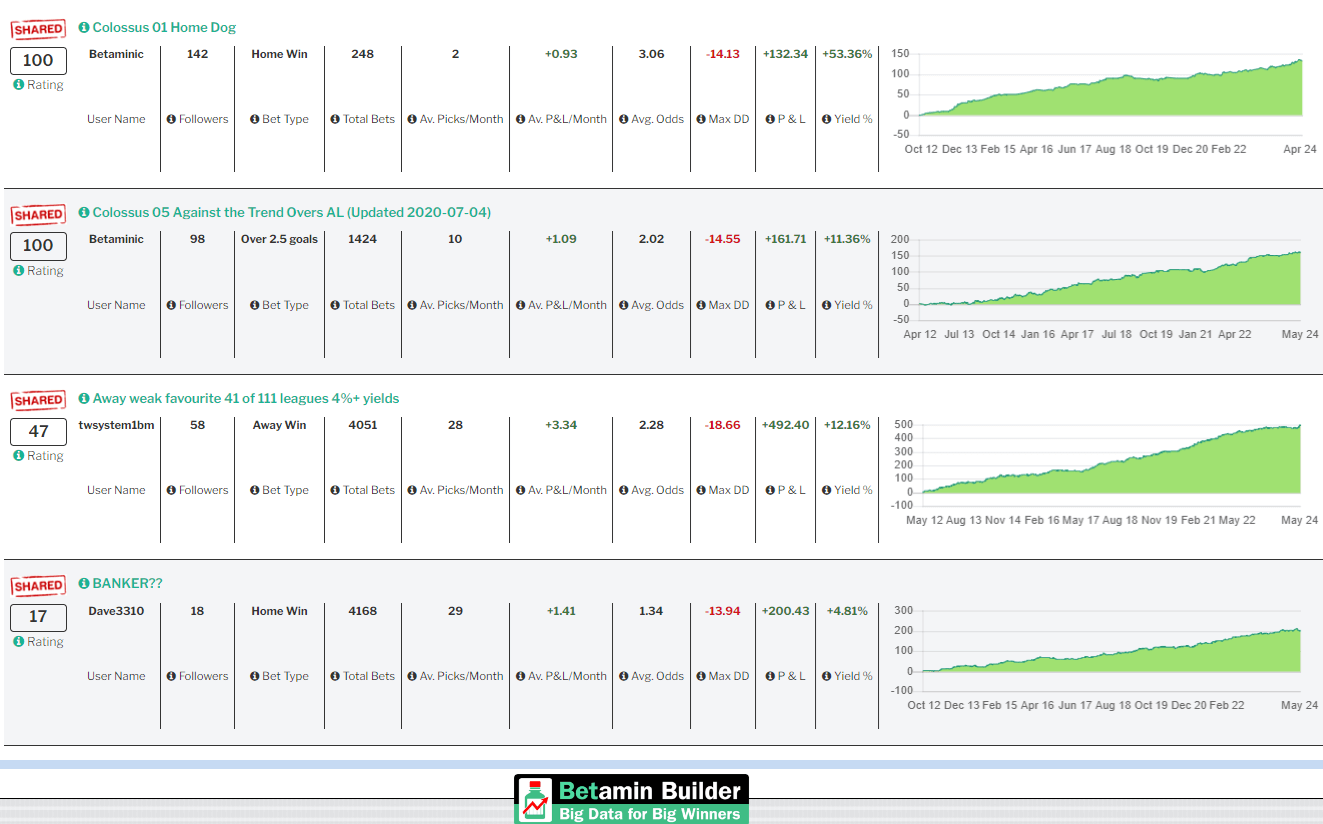
Having said that, we do understand that on Day 1, it can be hard to know which strategies to follow. For that reason, we have an example of a set of four low drawdown strategies that we think can form part of the beginning of your strategy portfolio if you are looking for ideas. These strategies have been running for a long time and have each had their turns at the top of the public strategies page with 100 ratings.
If you are logged into the Betaminic, then these links will take you directly to the strategy pages.
This strategy bets on home underdogs. It was shared on August 1st 2018 and is still going strong nearly 5 years later. The strategy only produces about 2 picks per month but has achieved an amazing 30% yield from 138 bets since then.
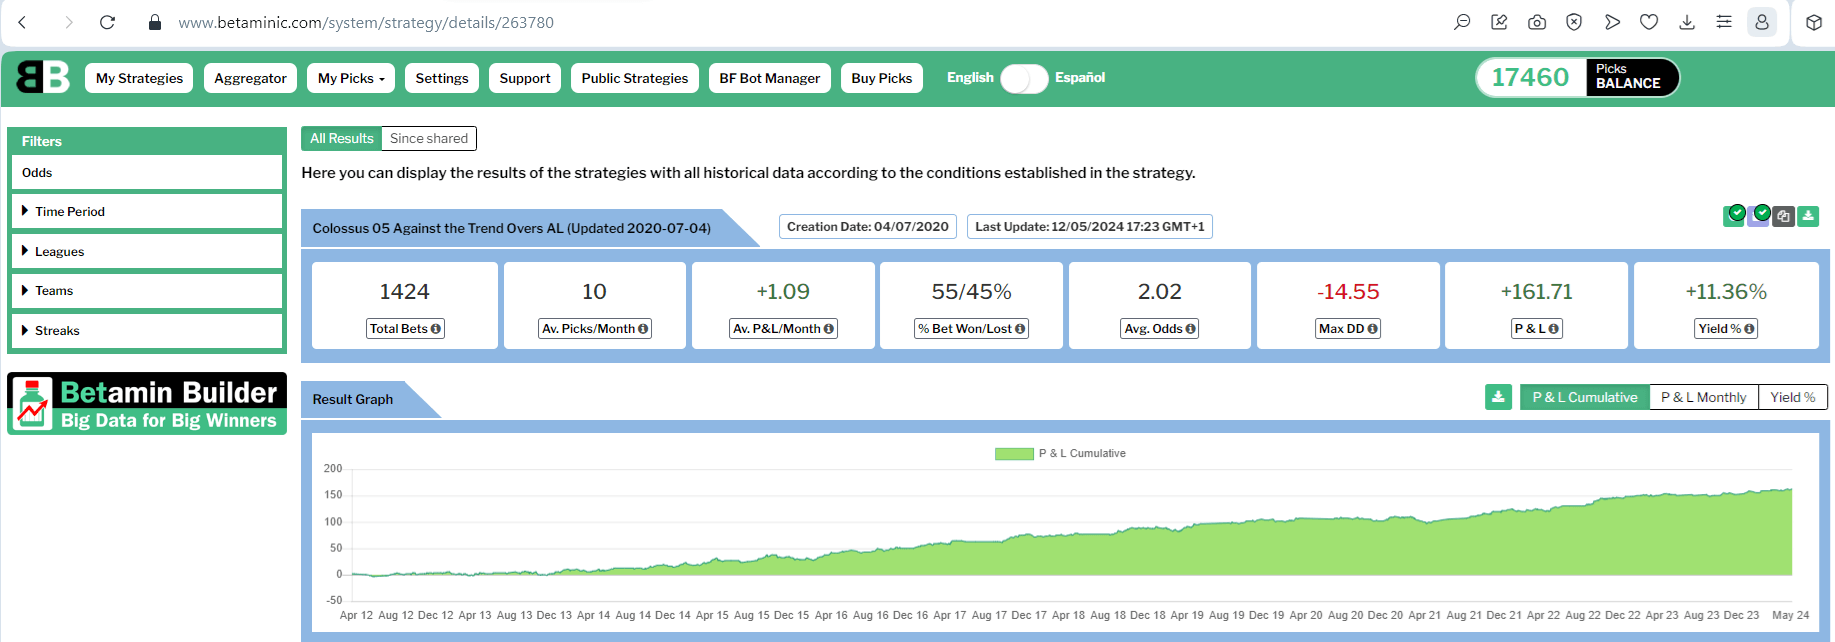
Colossus 05 Against the Trend Overs AL (Updated 2020-07-04)
This strategy bets on the over 2.5 goals bet and has made +53 points profit since July 2020 with an ROI of 13.86% during that time. It averages 10 picks per month.
Away weak favourite 41 of 111 leagues 4%+ yields
This strategy backs the away team and has made +81 points profit since September 2021 with an ROI of 7%. It averages 28 picks per month.
This strategy backs home favourites and has made +26 points profit since August 2022 with an ROI of 3.08%. It averages about 29 picks per month.
These 4 strategies follow four very different trends which we hope counterbalance and support each other to make a smoother upward profit graph.
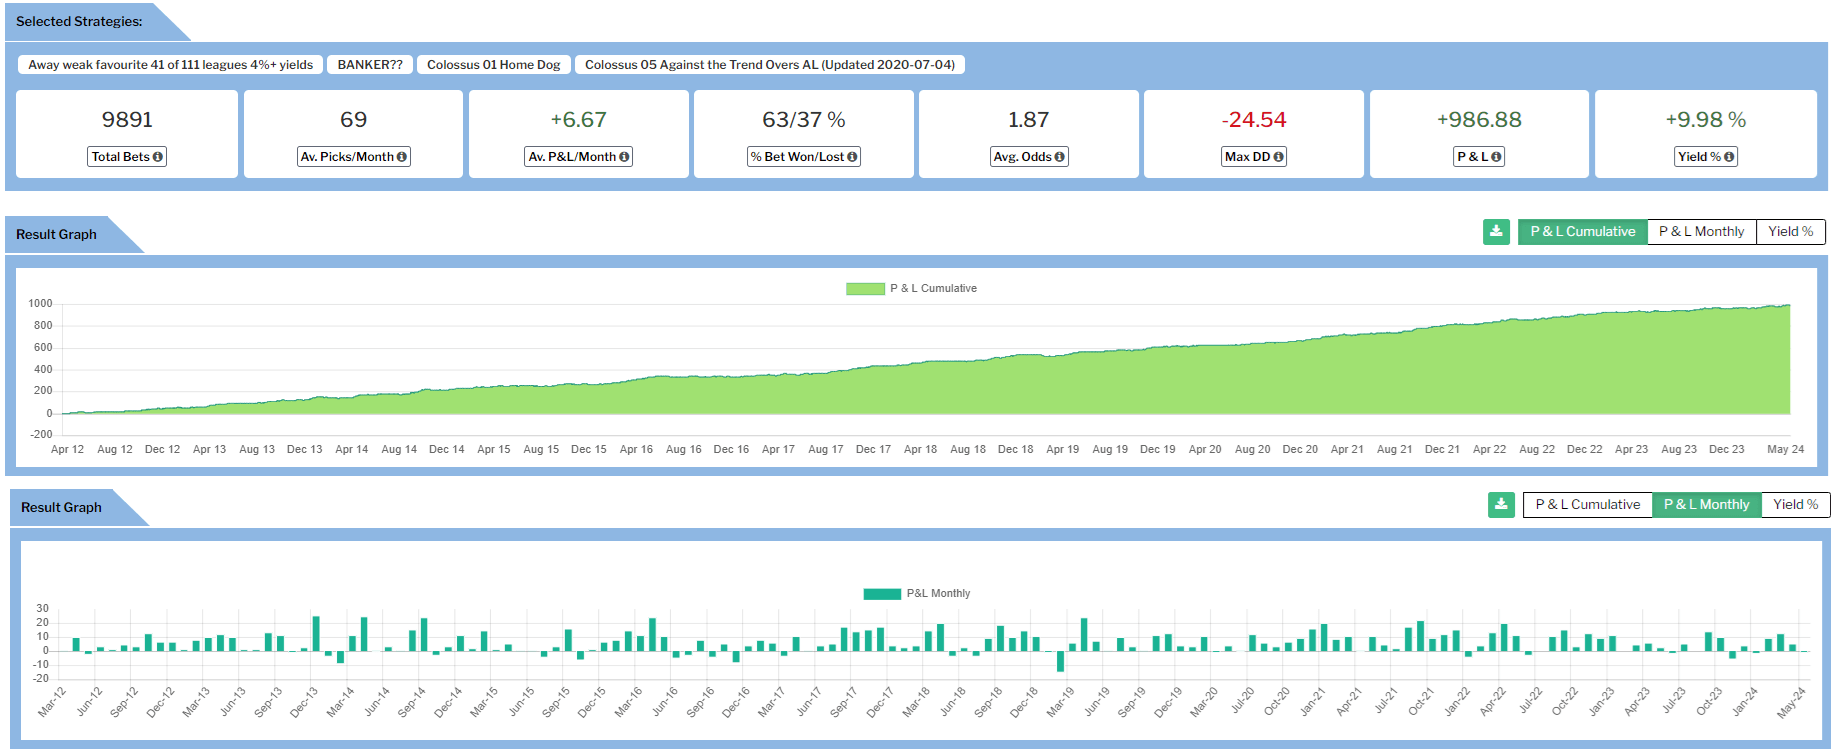
Test Multi-Strategy Systems in the Aggregator Tool
Each of these strategies has maximum drawdowns of under 19 points. By using them together in the Betamin Builder “Aggregator”, we can see how the strategies perform together. The maximum drawdown since 2012 has been -24.54 points. They have made an average of +6.67 points profit per month with a yield of 9.98%. The win rate of 63% and average odds of 1.87 make it a comfortable set to follow. These 4 strategies produce an average of 69 selections each month, so we would need a pick package to cover that number of picks per month for our betting plan.
Making a Long-Term Plan
Using a database like Betaminic gives us the chance to make betting plans with our eyes wide open. We know how it behaved over the past 12 years since 2012. It does not make profit every month and some months perform better or worse than others. To give the best chance of benefitting from this trend, we need to follow it long term, for at least 12 months. We need a plan for if things go right and for if things go wrong.
Cost Calculation
For example, if this set of 4 strategies continues its trend over the next 12 months, we could aim for 6.67 points x 12 months which equals 80.04 points. That is our ideal result if everything goes to plan. If the set has 69 picks per month, then it would need 69 picks x 12 months which equals 828 picks. It is important to keep the cost per pick as low as possible, so if we purchase 1,000 picks for €690 then we will have enough picks for our 1-year plan. Then each pick would cost €0.69. If we purchase the 2,000-pick package for €1,180, then each pick would cost just €0.59 and that gives room to follow other strategies during the course of the year, too. 828 picks x €0.69 per pick would cost €571.32 and 828 picks x €0.59 would cost €488.52. That gives us an idea of the costs involved for a 1-year plan and how larger pick packs reduce unit costs.
Profit Target Calculation
If we stake €50 on each selection, then we could aim for €50 x 80 points which equals €4,000 profit. Minus the pick cost of €488.52 leaves €3,511.48 profit.
Bank Size Calculation
Since the historical drawdown is -25 points, we would need a €50 x 25 at absolute minimum to follow this set of strategies for one year, which would be €1,250. But we strongly advise that people base their banks on a multiple of that aggregator Max DD (Maximum Drawdown) for safety’s sake. A standard bank might be the Max DD x1.5. A conservative bank might be the Max DD x2. The reason is that the Max DD tells us the drawdown that has happened in the past and we should definitely be prepared for that to happen again and then also have enough bank left to place bets as part of the rebound to the long-term trend. So a standard bank might be €50 x 25 Max DD x 1.5 multiple which equals €1,875.
Exit Points
Betaminic strategies find long term trends of value bets. They do not find bets that are expected to win every time. They find bets that have odds higher than their true probability, and that over the long term have the possibility of positive expected value. These 4 strategies have an average win rate of 63% so 37% of those bets will be losers even if everything goes to plan. But at what point would you want to stop and say the losses are too much? To avoid the stress of rethinking the plan every time a bet is lost, it is better to plan exit points from the start. We usually advise removing a strategy from a set if its current drawdown exceeds the Max DD at the start of the plan by 150% or x1.5.
Colossus 05 Against the Trend Overs AL (Updated 2020-07-04) MaxDD = 14.55 (x1.5 = 21.83)
Colossus 01 Home Dog MaxDD = 14.13 (x1.5 = 22)
Away weak favourite 41 of 111 leagues 4%+ yields MaxDD = -18.66 (x1.5 = 28)
BANKER?? MaxDD = -13.94 (x1.5 = 20.91)
If one of these strategies exceeds their MaxDD by 150%, then we would stop following just that single strategy, but continue following the others. We might then leave it as a set of 3 strategies, or replace the strategy with another one.
So exit point 1 is if a strategy exceeds its Max DD by 150%.
The other exit point would be at the end of the year when the 12-month plan is complete. This is not really a point to stop, but just a point to pause and review the portfolio, and then make a plan for the next 12 months, either with a larger bank with profit re-investment or with the same bank, or by adding in more strategies to the portfolio.
Professional bettors say it is important to become objective and remove the emotion from betting. By planning our entrance and exit points, by planning our bank and by having our selections automatically found and sent to us as part of a long-term strategy, we can achieve that objectivity and reduce the chance for rash, impulsive betting.
Does this work?
The results in the Betamin Builder are based on closing market odds used as a reference for comparative analysis.
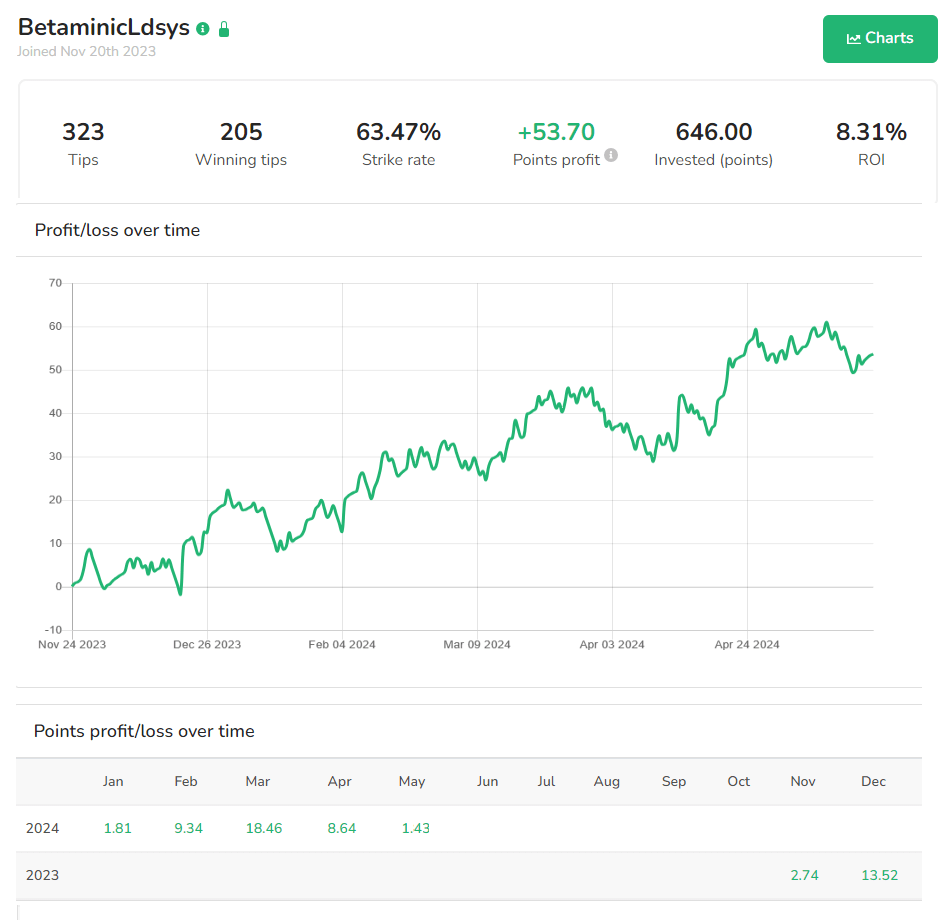
It is very likely that you can get better odds than these on other bookmakers and betting exchanges. For 3rd party verification and proof that Betaminic strategies work long term, you can see the performance of these 4 strategies with Betfair Exchange odds on our TippingSports account BettingLdsys where it is in its 7th month of profit of its 12 month plan. (Note that TippingSports results have 4% commission removed from the Betfair Exchange prices near KO.)
First Steps
Take a look at the public strategies.
If you are not sure of which ones to follow, then you can try starting with these 4 strategies.
Colossus 05 Against the Trend Overs AL (Updated 2020-07-04)
Away weak favourite 41 of 111 leagues 4%+ yields
Make a 12-month plan with profit targets and exit points clear in your mind.
Get started and power up your bets with Betaminic!