
What Odds Drop Alerts Reveal About Betting Value

Can an odds drop reveal a genuine betting opportunity? To investigate, we analysed 36,995 settled ShootingBets selections from the service’s launch in February 2024 through October 2026, using Bet365 prices recorded at alert time. The historical sample generated an 11.85% yield under a fixed-stake model, with results that can be examined by odds range, sport, market and year.
Rather than treating every falling price as a winning signal, this study asks a more useful question: what happened when a sharp-market odds movement triggered a ShootingBets alert and a Bet365 reference price was available? The findings illustrate both the opportunities and the fluctuations involved in data-led value betting.
Data snapshot: 21 October 2026. Historical performance is a model based on recorded bookmaker odds, not verified returns earned by individual subscribers. For continually updated figures, see the official ShootingBets results.
How do odds drop alerts identify potential betting value?
Betting odds change as a market absorbs new information and trading activity. A sharp bookmaker may react quickly when informed money moves towards a particular outcome, while prices at other bookmakers can take longer to adjust. That temporary difference is what a bettor looks for when comparing the available price with a reasonable reference.
ShootingBets monitors significant odds drops in sharp markets and sends alerts via Telegram. Each alert includes a minimum recommended price. The useful opportunity is not the drop itself: it is finding an eligible bookmaker quote at or above that threshold before prices move further.
For example, an alert may indicate that a selection has moved sharply in the reference market while a slower-moving bookmaker still offers a higher price. The reader can then check the selection, its market and its minimum price. If the available odds no longer meet the threshold, the rational choice is to pass rather than chase the move.
This distinction also separates our research from a simple opening-versus-closing odds comparison. Here we evaluate a historical set of alerts and the bookmaker prices recorded when the alerts were sent, not prices reconstructed afterwards.
ShootingBets historical results since launch
The following summary follows the same W/L, €50 fixed-stake calculation used for the published ShootingBets results. It begins at the launch cutoff on 9 February 2024, 18:45 UTC.
| Metric | Historical result |
|---|---|
| Winning selections | 16,987 |
| Losing selections | 20,008 |
| Win rate | 45.92% |
| Average recorded Bet365 odds | 2.831 |
| Total modelled stakes | €1,849,750.00 |
| Cumulative modelled P/L | +€219,118.50 |
A 45.92% win rate may look modest on its own, but it needs to be interpreted alongside the 2.831 average odds. At higher prices, a smaller proportion of wins can still produce a positive return. That is why yield, sample size and drawdown tell a more complete story than strike rate alone.
How were the historical results calculated?
We analysed ShootingBets alerts from the service’s launch on 9 February 2024, using the same rules as the official results page. To make the comparison consistent, we focused on alerts that ShootingBets identified as offering value at Bet365 and for which the selection had been settled as a win or loss. Void, refunded and unresolved selections are not part of these results.
We used the Bet365 odds recorded when each alert was sent; those prices are not changed afterwards. Every selection is measured with a fixed €50 stake: a winning bet earns a profit based on its recorded odds, while a losing bet loses €50. From these results we calculate the total profit, win rate, yield (profit as a percentage of money staked) and maximum drawdown (the largest fall in accumulated profit from an earlier peak).
Bet365 provides a consistent reference for this study, but users may also find qualifying prices with other bookmakers. The figures describe a historical fixed-stake simulation at the recorded odds, not profits guaranteed to individual subscribers.
Which betting odds ranges performed best?
Segmenting the sample by the recorded Bet365 odds reveals an important difference between win rate and yield. Lower-odds selections win more frequently, but their payout per winning bet is smaller. Higher odds can create a larger return per successful selection, with more frequent losing bets between wins.
| Bet365 odds | Bets | Win rate | Average odds | Modelled P/L | Yield |
|---|---|---|---|---|---|
| 1.01-1.49 | 809 | 77.13% | 1.399 | +€3,165.00 | +7.82% |
| 1.50-1.99 | 9,920 | 61.43% | 1.793 | +€47,586.95 | +9.59% |
| 2.00-2.49 | 9,415 | 50.01% | 2.197 | +€44,795.50 | +9.52% |
| 2.50-2.99 | 5,482 | 42.65% | 2.675 | +€38,012.50 | +13.87% |
| 3.00-3.99 | 6,014 | 33.92% | 3.378 | +€41,380.00 | +13.76% |
| 4.00-5.99 | 3,586 | 25.18% | 4.674 | +€29,888.55 | +16.67% |
| 6.00+ | 1,769 | 15.83% | 7.561 | +€14,290.00 | +16.16% |
What stands out in the odds data?
The 1.50–2.49 combined interval accounts for 19,335 selections, more than half the sample, at roughly 9.5% historical yield in each constituent band. The 2.50–3.99 bands also contain substantial samples, with historical yields around 13.8%. The 4.00–5.99 band produced the highest yield in this breakdown, 16.67%, from 3,586 selections.
These are useful descriptive findings, not a reason to assume the highest-priced alerts are always the best choice. Longer losing runs become more likely as the average odds increase, and the odds range that performed best historically may not remain the leader in future samples. A bettor’s preferred range should reflect the volume and volatility they are comfortable managing.
Which sports and betting markets generated the results?
ShootingBets is not restricted to football. The settled Bet365 benchmark sample contains selections from soccer, tennis, basketball, handball and volleyball, across Moneyline, Spread and Totals markets. The number of qualifying selections differs considerably between combinations, so sample size matters as much as the headline percentage.
| Sport | Market | Settled bets | Avg odds | Modelled P/L | Yield |
|---|---|---|---|---|---|
| Soccer | Moneyline | 22,868 | 3.125 | +€138,719.60 | +12.13% |
| Soccer | Spread | 3,514 | 2.304 | +€23,411.25 | +13.32% |
| Soccer | Totals | 2,522 | 2.356 | +€2,073.15 | +1.64% |
| Tennis | Moneyline | 2,432 | 2.502 | +€19,651.00 | +16.16% |
| Basketball | Moneyline | 2,129 | 2.661 | +€17,629.50 | +16.56% |
| Basketball | Spread | 1,674 | 2.109 | +€8,238.00 | +9.84% |
| Basketball | Totals | 557 | 2.232 | +€3,658.00 | +13.13% |
| Handball | Totals | 499 | 1.863 | +€1,200.50 | +4.81% |
| Handball | Moneyline | 352 | 2.484 | −€212.00 | −1.20% |
| Volleyball | Spread | 301 | 2.005 | +€4,025.50 | +26.75% |
| Handball | Spread | 114 | 1.878 | +€647.00 | +11.35% |
| Volleyball | Moneyline | 33 | 2.402 | +€77.00 | +4.67% |
Soccer Moneyline was the largest contributor by volume, with 22,868 settled selections and a 12.13% yield. Tennis Moneyline (2,432 selections; 16.16% yield) and Basketball Moneyline (2,129; 16.56%) also produced substantial positive samples. Volleyball Spread recorded a particularly high 26.75% yield, but over a smaller set of 301 selections.
Not every subgroup was positive: Handball Moneyline recorded a -1.20% yield over 352 selections. Presenting those differences is valuable because it shows why a broad historical result should not be treated as an identical expectation for every sport and market.
Historical consistency, yearly results and maximum drawdown
Yield measures the amount won or lost per unit staked; it does not describe the journey between those outcomes. To understand whether performance was concentrated in one period, we also grouped the selections by the UTC month of each event’s scheduled start.
| Year | Settled bets | Months analysed | Modelled P/L | Yield |
|---|---|---|---|---|
| 2024 (partial) | 8,557 | 11 | +€53,345.05 | +12.47% |
| 2025 | 17,371 | 12 | +€99,390.35 | +11.44% |
| 2026 (partial) | 11,067 | 10 | +€66,383.10 | +12.00% |
The annual yields were 12.47% in 2024, 11.44% in 2025 and 12.00% in 2026 (partial). Across the available calendar-month breakdown, all 33 observed months recorded positive aggregate W/L P/L. That consistency is a notable property of this historical benchmark, but it does not mean there were no losing days, weeks or individual selections.
Maximum drawdown: €2,652.10, or 53.04 units
Maximum drawdown measures the largest fall in cumulative P/L from a previous peak to a subsequent low point. In this sample, the largest recorded drawdown was €2,652.10 (approximately 53.04 units at €50 per selection), with the trough recorded on 29 July 2025 (UTC). It was calculated across selections ordered by scheduled event time and event ID, from a starting balance of zero.
That figure matters for any bettor assessing bankroll exposure. Even a historically profitable set of bets can suffer meaningful periods of decline. The maximum drawdown shown here is historical, not a ceiling on what could occur in the future. For further reading, see our guide to staking plans and bankroll analysis.
View the complete month-by-month results (33 periods)
| Month (UTC) | Settled bets | Modelled P/L | Yield |
|---|---|---|---|
| 2024-02 | 373 | +€3,181.65 | +17.06% |
| 2024-03 | 764 | +€1,051.40 | +2.75% |
| 2024-04 | 894 | +€8,707.70 | +19.48% |
| 2024-05 | 907 | +€6,337.50 | +13.97% |
| 2024-06 | 499 | +€1,627.20 | +6.52% |
| 2024-07 | 478 | +€1,374.90 | +5.75% |
| 2024-08 | 536 | +€5,652.45 | +21.09% |
| 2024-09 | 713 | +€5,622.30 | +15.77% |
| 2024-10 | 1,405 | +€5,987.30 | +8.52% |
| 2024-11 | 1,190 | +€8,920.70 | +14.99% |
| 2024-12 | 798 | +€4,881.95 | +12.24% |
| 2025-01 | 711 | +€1,406.05 | +3.96% |
| 2025-02 | 626 | +€4,324.55 | +13.82% |
| 2025-03 | 1,202 | +€11,829.70 | +19.68% |
| 2025-04 | 1,908 | +€14,716.75 | +15.43% |
| 2025-05 | 1,930 | +€13,921.65 | +14.43% |
| 2025-06 | 1,402 | +€4,099.30 | +5.85% |
| 2025-07 | 1,304 | +€1,117.55 | +1.71% |
| 2025-08 | 1,808 | +€6,330.90 | +7.00% |
| 2025-09 | 1,872 | +€10,129.05 | +10.82% |
| 2025-10 | 2,308 | +€15,948.95 | +13.82% |
| 2025-11 | 1,524 | +€9,293.80 | +12.20% |
| 2025-12 | 776 | +€6,272.10 | +16.17% |
| 2026-01 | 1,067 | +€5,485.60 | +10.28% |
| 2026-02 | 741 | +€5,517.20 | +14.89% |
| 2026-03 | 974 | +€4,769.25 | +9.79% |
| 2026-04 | 1,044 | +€3,825.25 | +7.33% |
| 2026-05 | 1,489 | +€6,196.75 | +8.32% |
| 2026-06 | 1,179 | +€7,417.80 | +12.58% |
| 2026-07 | 1,456 | +€13,564.70 | +18.63% |
| 2026-08 | 1,151 | +€4,708.80 | +8.18% |
| 2026-09 | 1,183 | +€10,996.30 | +18.59% |
| 2026-10 | 783 | +€3,901.45 | +9.97% |
Using ShootingBets alerts in practice: free access and Premium filters
The research describes a broad historical record. Individual bettors, however, may prefer a more selective approach. ShootingBets provides alerts through Telegram, and Premium subscribers can configure which types of alerts they receive from their ShootingBets subscription dashboard.
Available filter controls include sports, minimum and maximum selection odds, and a validated alerts only setting, alongside an estimated alert-volume preview. This allows users to compare a wide feed with a narrower one without changing the underlying alert signals.
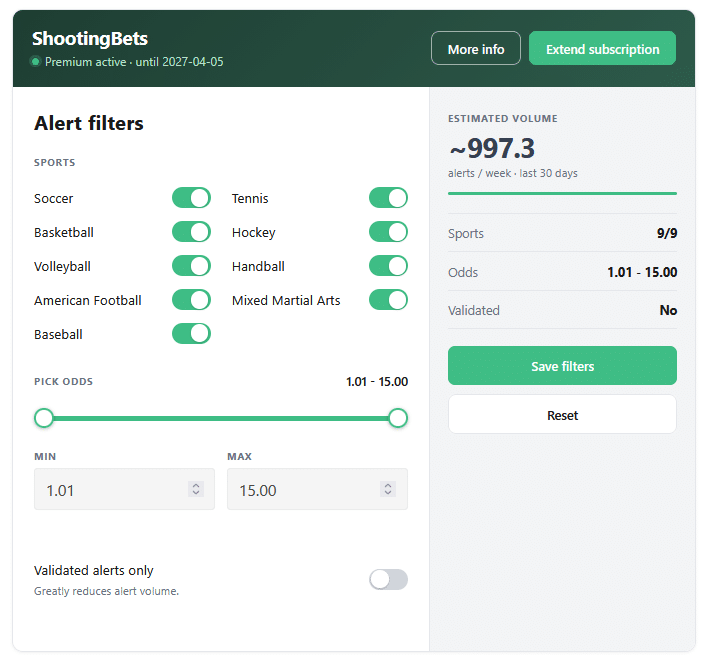
A user interested in shorter prices could concentrate on a low-odds band, while someone researching higher-odds selections could take a different approach. The value of these filters is control and focus, not any guarantee that the historical best-performing subgroup will repeat its results.
Free registration offers a way to explore ShootingBets with a limited number of alerts. Users who want unlimited alerts and custom filtering can review the current options on the ShootingBets pricing page.
Four steps to start receiving ShootingBets alerts

1. Register for free
Create a Betaminic account if you do not already have one.

2. Connect with Telegram
Open the ShootingBets Telegram bot.

3. Complete the setup
Follow the bot’s instructions to register your email address.

4. Review your alerts
Check the minimum recommended odds and decide whether an eligible price is available.
Quick execution and price discipline matter with moving markets. For practical considerations around sportsbook accounts, read 23 tips on how to avoid getting banned by bookies when using ShootingBets.
Frequently asked questions about odds drop alerts
What is an odds drop alert?
It is a notification that a betting price has moved down significantly in the monitored market. ShootingBets uses movements from a sharp bookmaker to identify selections worth checking against prices elsewhere.
Does falling odds mean a guaranteed profitable bet?
No. A price movement is a signal to investigate, not a guarantee. The relevant question is whether the price you can actually place is at or above the minimum recommended level, and whether the selection fits your approach to risk.
Why does this study use Bet365 prices?
Bet365 provides a consistently recorded reference price for the published results. The quote is saved when the alert is issued and is not revised later. Other bookmakers may have offered suitable prices too, but those additional opportunities are outside this particular benchmark calculation.
What is the difference between win rate and yield?
Win rate measures the percentage of winning selections. Yield compares the cumulative P/L with the total amount staked. Since higher odds pay more when successful, yield cannot be inferred from win rate without also considering the prices of the winning bets.
How is maximum drawdown calculated?
It is the greatest fall from a previous high in the cumulative profit-and-loss series to a subsequent low. Here the historical maximum was €2,652.10, equivalent to about 53.04 stakes of €50.
Can I filter ShootingBets notifications?
Yes. Premium users can choose sports, odds ranges and validated-only alerts from the subscriber dashboard. The free plan provides limited alerts; Premium provides unlimited alerts and filter controls.
What do the historical results tell us?
The strongest conclusion is not that every odds drop creates value, but that monitoring sharp-market movements, checking a recorded bookmaker price and following a disciplined selection rule produced a substantial and consistently positive historical W/L benchmark in this dataset. The performance can be studied by odds band, sport, year and drawdown rather than relying on a single headline return.
ShootingBets makes that monitoring process more accessible through Telegram alerts and selectable filters. Readers who want to see how it works can create a free Betaminic account and consult the ShootingBets overview; the plan comparison explains the additional Premium options.
Research note: Source: first-party ShootingBets alert history exported on 21 October 2026. The sample includes 36,995 settled W/L selections after the 9 February 2024 launch cutoff, following the site’s published Bet365 flag and €50 flat-stake P/L rules. Currency figures are modelled, not reported customer transactions. These figures describe past recorded odds and do not predict future performance. The latest results can differ from this frozen snapshot.
More Betaminic research and guides
- ShootingBets live historical results and individual selections
- Analysing odds movements in football betting: profitable or random?
- 23 tips on how to avoid getting banned by bookies when using ShootingBets
- Best staking plans: managing bets and drawdown
- Betamin Builder: explore and backtest football betting strategies
- Betlamp: free football statistics and custom alerts
- ShootingBets FAQs