Strategy: Bet on the Underdog at home 2.0
Strategy Detail
Hi everyone,
In the spirit of improving as well as making the procedure more user-friendly, we have developed a new enhanced version of the original strategy “Bet on the Underdog at home”.
Reasons to create this new version 2.0
We take a look at the reasons why we decided to build a new strategy based on the original.
- We received feedback from our users regarding receiving the picks much further in advance. As the conditions were based on the closing odds, it was not possible to send all the picks earlier, because some games don’t reach the odds required until a couple of hours before the match starts. We understand sometimes there is no time to place a bet if you receive the picks a few hours before the game, besides the trouble to keep an eye on the odds movement. Therefore, now the follow-up is more convenient, whether you are subscribed to the strategies or follow the system on your own account.
- When the first strategy was published, we only had data of some leagues. Now, we have more leagues data available.
- Most of the games selected on the original strategy are included in the new version, and also more picks will be triggered by the new system.
- After analysing the figures of the new version, they show better results compared to the original one, more bets and similar yield.
The changes of the new strategy compared to the previous one are as follows:
- The strategy will use opening odds instead of closing odds to select the games of the strategy, due to the fact that the opening odds are known well in advance.
- We have added new leagues to the strategy that help to improve the overall results, which is a good indication of the health of the strategy.
- The rest of the filters and conditions remain unchanged.
These are the details of the new version of the strategy, named it as “Bet on the Underdog at home 2.0.”
Summary of the results
| Total Bets | Bets Won | Bets Lost | Av. Odds | Net Profit!!! | Yield!!! |
| 766 | 293 | 473 | 3.21 | +144.98 | +18.92% |
Description of the Strategy
This system is based on the trends of the teams for a short time, the last three games. The goal of this strategy is to search teams playing at home with a good winning streak as a Home team, and the rival team should have the opposite trend: NO Wins when played away in the last three games. We are searching games where the good results of the home team in the short term can continue, at least in the next match.
We want to take advantage of the good form of the home teams, although the odds set for that team are against them.
For this strategy, we are using opening odds to select the matches and closing odds to calculate the P/L mainly for two main reasons. On the one hand, you will receive the picks of the strategy well in advance due to the fact that the opening odds are known beforehand. And, on the other hand, the P/L of the system is based on closing odds to allow the figures to be as realistic as possible. Nevertheless, the final results of the strategy do not differ in any great if we take the opening odds to estimate the profit and loss. We will send the picks by email with “minimum suggested odds”, that means you will have a reference point to place your bets.
Strategy Results by year
Here you can see a breakdown of the results by year.
| Year | Bets | Net Profit | Yield |
| 2012 | 53 | +3.64 | +7% |
| 2013 | 165 | +41.97 | +25% |
| 2014 | 196 | +46.66 | +24% |
| 2015 | 155 | +17.47 | +11% |
| 2016 | 179 | +25.72 | +14% |
| 2017 | 18 | +9.52 | +50% |
| TOTAL | 766 | +144.98 | +19% |
The table shows that the strategy has consistent results over the period. There have been years with a higher yield than others, but it generally remains constant.
System Parameters
These are the filters or conditions used for this system:
- Leagues. We have tested this strategy with 27 leagues.
- Odds. Odds are taken from Pinnacle Sports, opening odds to select the games and closing odds to calculate the P/L.
- Seasons. From season 2012/2013 to the current one 2016/2017.
- Date range. From May 2012 to 15/02/2017.
- P/L Calculation method. To bet one unit on the Home Team to win, when the conditions are fulfilled.
- Home Team conditions. At least two wins in the last three games played at home.
- Away Team conditions. No wins in the last three games played away.
- Odds for Home Team. Opening odds must be greater than or equal to 2.60 (decimal odds).
- The Trigger of the system. If those conditions are fulfilled, the system places a bet on the fourth match on the Home Team to win.
- Yield. The Yield obtained in the system: 19% after 766 bets matched in the strategy.
| Yield %: Net Profit or Loss / Total Stake * 100% |
Win/Lost Bets Ratio
For this betting system, we obtain a 38% ratio of winning bets. This is because the odds selected in the strategy are a bit high.
| Total bets | Ratio | |
| Bets Won | 293 | 38% |
| Bets Lost | 473 | 62% |
The past results show that about one in three bets is a winning bet. You should consider all these factors explained above before taking a decision. If you decide to follow this strategy, please remember that you have the final say to place a particular bet.
Discover 8 new profitable football betting systems based on Big Data clicking here!!!
Table #1. Analysis of the results by League
** Please note that the table only shows 10 results by default, you can change that in the “show entries” box to display all results.
Strategy Underdog 2.0 - League Analysis -
The system obtains a positive result, a 19% yield after 766 bets during five years. As you can check, the system is profitable for most of the football leagues tested. Turkey Superlig scores the best result with a Net Profit of +23.78, that means a 72% Yield closely followed by Serie B (Brazil) with 69% Yield. Only four leagues have negative results for this study, Belgium, Spain Primera Division, Bundesliga 2 and Italy Serie A.
You can display the chart of the leagues:
Table #2. Analysis of the results by Odds range
Strategy Underdog 2.0 - Odds range -
If we analyse the results by odds range, we can confirm that the system works for every interval, where the yield keeps constant at each odds and for every year. Each interval has a consistent profit; that means that those odds fit for the strategy. The best odds interval is between 2.60 and 3.00 (opening odds), with 46% of the total profit.
In this chart, you can see the distribution of the profit per odds interval.
Table #3. Detail of the football games included in the strategy
Here you can find the detail of all the past football games that fulfil with the filters and conditions of the betting system.
All the matches and results are the outcome of the strategy previously explained in a transparent manner. Errors and omissions excepted, these are the past games that comply with the requirements of the strategy.
Football Matches included in the Underdog 2.0 Strategy
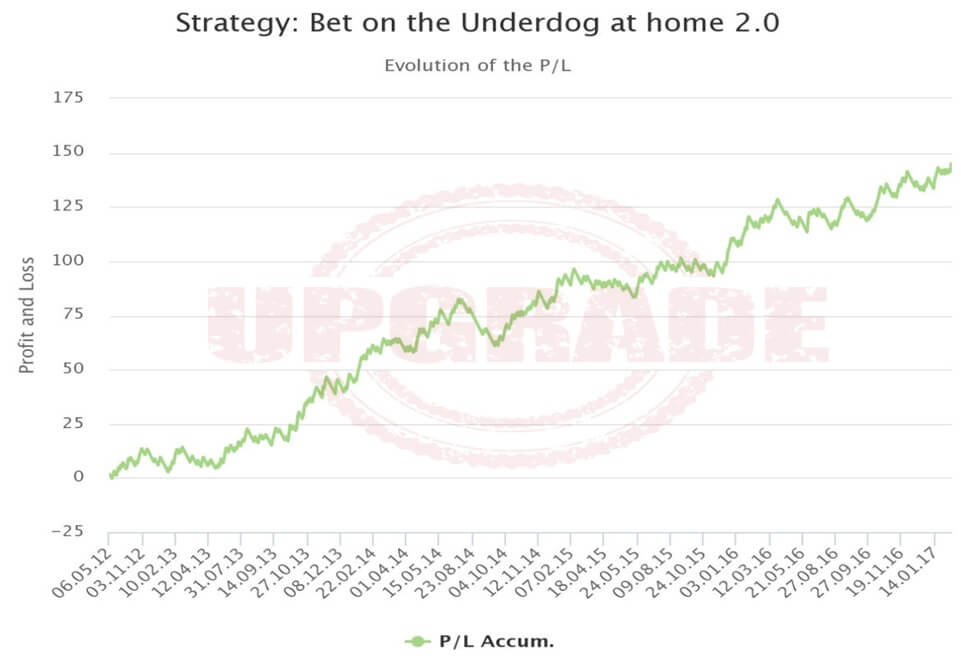
This chart shows the progress of the results by date.
If you look closely at the chart, you can realise the profits increase slowly, but gradually. Here, the strategy suffers the worst negative streak between August and September 2014, it lasted only for a couple of months, although adding about 20 points of losses. But the best part was that it recovered relatively early, in November 2014. Besides, there are some extended periods of time, close to one year, where the strategy generated hardly any profit, as it happened from January to October 2015. The drawdown for the period studied is not very high but a little long.
Drawdown
Why is the drawdown so important?
When you start designing a new strategy, one of the key factors of a risk assessment is the maximum drawdown of the system. If you develop a strategy making a profit overall, it’s vital to calculate its max drawdown. It will help you to estimate the risk you are willing to assume. It is so important the maximum amount of loss as well as the length of that period.
The study of the maximum drawdown has to be compared with the total profit of the strategy to establish the risk of the system. If you calculate the amount and duration of the worst losses of the past results, you will be able to identify at any moment whether the behaviour of the strategy is indeed withing the normal limits. That will help you to control your emotional situation for losses streaks.
We are going to calculate the maximum drawdowns for this strategy.
Estimated level of risk: MEDIUM.
| Year | Max DD | From | To | Length |
| 2012 | -9.99 | 03.11.12 | 26.12.12 | 53 days |
| 2013 | -9.79 | 23.02.13 | 27.04.13 | 63 days |
| 2014 | -21.56 | 09.08.14 | 21.09.14 | 43 days |
| 2015 | -13.17 | 10.02.15 | 21.05.15 | 100 days |
| 2016 | -15.12 | 09.04.16 | 04.06.16 | 56 days |
| MAX DD | -21.56 | 09.08.14 | 21.09.14 | 43 days |
P-value
For this strategy, the Approx. P-value = 0.001, wich means we have strong evidence that the results for this systems are not a matter of only luck.
For those who might be unfamiliar with the p-value concept, here you can find a brief explanation: The P-value, or calculated probability, is the probability of finding the observed, or more extreme, results when the null hypothesis (H0) of a study question is true – the definition of ‘extreme’ depends on how the hypothesis is being tested. P is also described in terms of rejecting H0 when it is actually true, however, it is not a direct probability of this state.
| P > 0.10 |
No evidence against the null hypothesis. The data appear to be consistent with the null hypothesis.
|
| 0.05 < P < 0.10 | Weak evidence against the null hypothesis in favour of the alternative. |
| 0.01 < P < 0.05 |
Moderate evidence against the null hypothesis in favour of the alternative.
|
| 0.001 < P < 0.01 |
Strong evidence against the null hypothesis in favour of the
alternative.
|
| P < 0.001 |
Very strong evidence against the null hypothesis in favour of the alternative.
|
Conclusions
As you can check, this system makes a profit for most of the leagues and the period tested. This strategy is based 100% on statistical data. As we have mentioned many times, this kind of strategies are studied with historical data; nobody can be sure this system will continue making profits in the future.
We advise following this strategy for a long period of time. If you follow a strategy like that, it may take several months until it starts making a profit, but if you leave the system too soon, you could miss te good results for the future. One of the worst enemies of the bettor is usually the impatience.
In case you decide to pursue this strategy, please take into account all theses factors before starting this adventure. We think this system can be very profitable in the long term, but as you already know, cycles can change, and past results do not guarantee future performances. This strategy will be reviewed periodically to make small enhancements to improve the end result.
We know it’s not an easy task to deal with the emotional, but If you can stand long negative streaks, you will get more chances to succeed in the world of the sports betting.
As we usually advise, we recommend you not to pull all your eggs in one basket. You will have more chances to success in the long term if you can combine some systems within your personal strategy. We are here to help you, publishing more studies of this nature.
As we said before, if you want to propose a particular betting system to be analysed, please send us an email to su*****@*******ic.com or using our contact form, we will be glad to help you.
Thanks!