Would you like to analyze football leagues and team statistics in a simple and practical way? You have at your fingertips data from more than 100k football games that will allow you to examine a wide variety of information in seconds. You will find very useful statistics for your bets, such as finding out the percentage variation of odds since they are published, average goals per game, results at half-time and full-time, percentage of match scores and much more data of great value available for your studies.
You can combine a large number of filters among the different sections to get the maximum detail of what you are investigating. In addition, it is a perfect complement to the profitable strategies tool Betamin Builder, since it will allow you to obtain very valuable information to apply to your own strategies. It can also be used together with the Betlamp statistics tool to receive personalized alerts in your email.
DATA UPDATED DAILY!
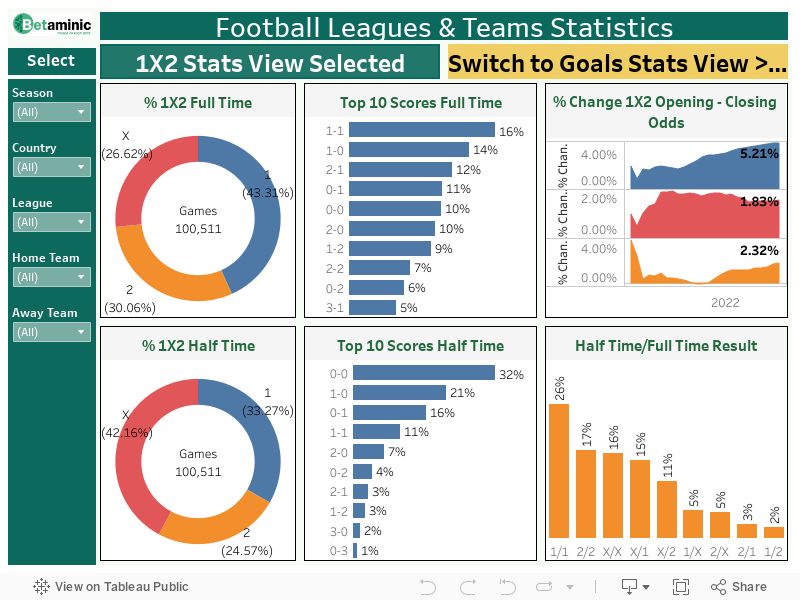
1X2 Stats View
- % 1X2 Full Time. Percentage of games won by the home team (1), draw (X) or won by the away team (2) during full time, without overtime or penalties.
- % 1X2 Half Time. Percentage of games won by the home team (1), draw (X) or won by the away team (2) during half time.
- Top 10 Scores Full Time. It shows the top 10 scores with the highest percentage at full time, without overtime or penalties.
- Top 10 Scores Half Time. It shows the top 10 scores with the highest percentage at half time.
- % Change 1X2 Opening – Closing Odds. This shows the average percentage change of 1X2 odds from their opening odds (when they were first published) to their closing odds (the last odds available before kick-off.) Both odds are from Pinnacle Sports bookmaker. A positive percentage indicates the closing odds were higher than the opening odds, therefore the odds went up. For example, a change of 3.50% for “1” (home wins) means there was an average increase of 3.50% in the odds for the selected period. When hovering the mouse over the graph, the average % change of a range of data can be seen. For example, if the graph shows “Date: 2020 Q1 % Change Odds 1: 1.40%”, it means that the average % change of odds in the period from the start of the graph (default start date is 2012 Q1) until 2020 Q1 was 1.40%. It does not refer only to 2020 Q1. To see the data for specific seasons, use the season filters option on the left of the chart.
- Half Time/Full Time Result. Percentage of games according to the results at half-time and full-time.
Goal Stats View
- % OU 2.5 Full Time. Percentage of games finished over or under 2.5 goals at full time, without overtime or penalties.
- % OU 1.5 Half Time. Percentage of games finished over or under 1.5 goals at half time.
- Top 5 Goals Scored per Game FT. It shows the 5 highest percentages of the number of goals scored at full time, without overtime or penalties.
- Top 5 Goals Scored per Game HT. It shows the 5 highest percentages of the number of goals scored at half time.
- % Change OU 2.5 Opening – Closing Odds. This shows the average percentage change of OU 2.5 goals odds from their opening odds (when they were first published) to their closing odds (the last odds available before kick-off.) Both odds are from Pinnacle Sports bookmaker. A positive percentage indicates the closing odds were higher than the opening odds, therefore the odds went up. For example, a change of 3.50% for “O2.5” (Over 2.5 goals) means there was an average increase of 3.50% in the odds for the selected period. When hovering the mouse over the graph, the average % change of a range of data can be seen. For example, if the graph shows “Date: 2020 Q1 % Change Odds O2.5: 1.40%”, it means that the average % change of odds in the period from the start of the graph (default start date is 2012 Q1) until 2020 Q1 was 1.40%. It does not refer only to 2020 Q1. To see the data for specific seasons, use the season filters option on the left of the chart.
- Average Goals Per Game. It shows the average of goals scored at full time without overtime or penalties (FT) and half time (HT).
Our intention is to add more reports of this type and make it useful for your analyzes, with the ultimate goal that you can improve your betting results. You can send us your suggestions to su*****@*******ic.com and we will try to create the reports you request, whenever possible.