
Do you want to know the best staking plan for your Betaminic betting system?
Do you want to know the most profitable odds bands, the volatility, win/lose sequences, drawdowns and other key characteristics of your bet history?
This article will show you in detail the steps to import data from Betaminic to The Staking Machine for staking analysis.
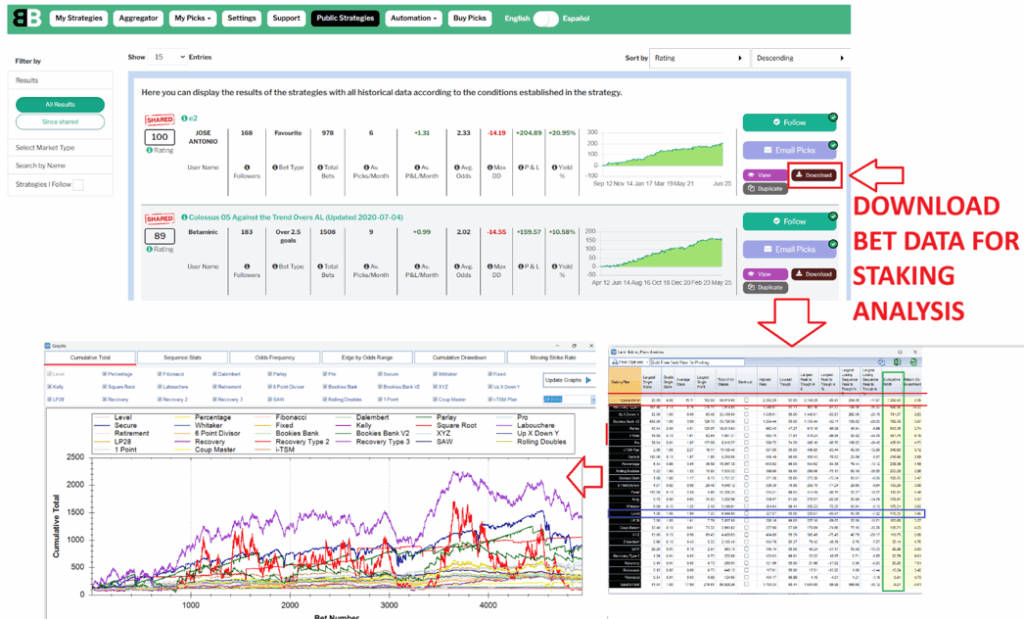
In the Betamin Builder, you can download all historical results of public strategies so that you can analyse them in spreadsheets or staking analysis software. This can help you perfect your betting plan.
The Staking Machine (TSM) is the most advanced staking analysis software available.
You can import Betaminic bet data into TSM and easily apply staking plans to find the best staking plan for your system.

The Staking Machine has 48 staking plans: 28 back staking plans, 18 lay staking plans and 2 each way staking plans.
28 Back Staking Plans
Level
Whitaker (ELS Adjusted)
Secure (Odds Adjusted)
Fixed (Target Profit)
Percentage
1 Point Back
1326
6 Point Divisor
Bookies Bank
Bookies Bank V2
Coup Master
D’alembert
Fibonacci
i-TSM Plan
Kelly
L.P. 28
Labouchere
Parlay
Pro
Recovery
Recovery Type 2
Recovery Type 3
Retirement
Rolling Doubles
SAW
Square Root
Up X Down Y
XYZ
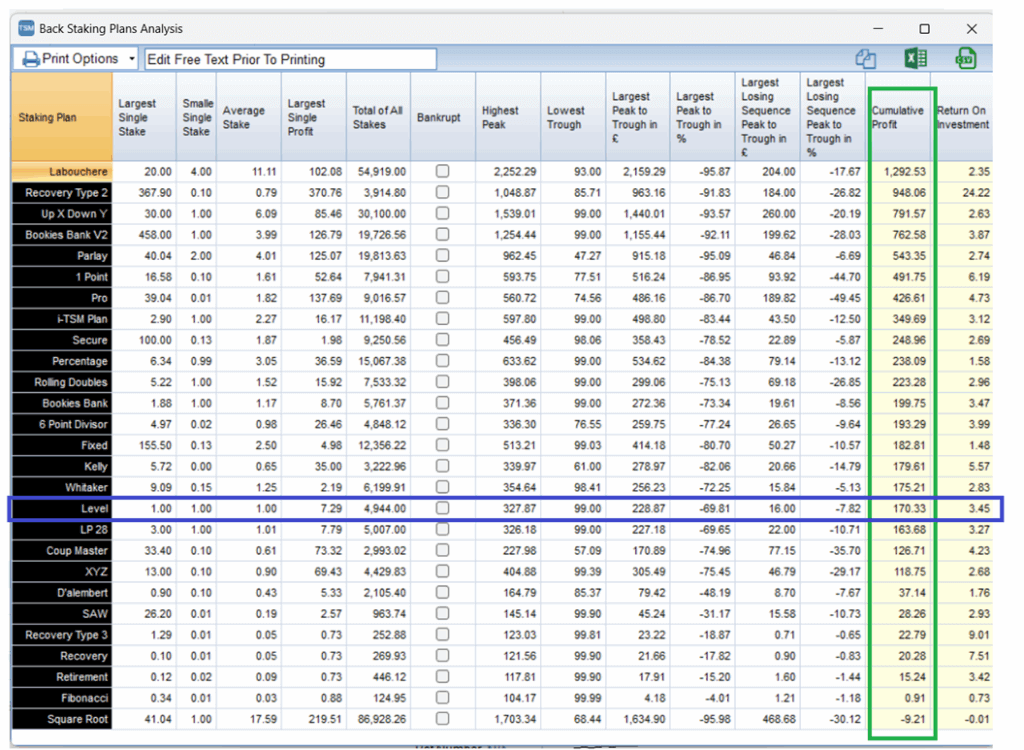
Ranked Profit Tables
You can see sortable tables to instantly know which staking plan worked best without going bankrupt. The tables show the bank lows, biggest stakes, ROI, and more.
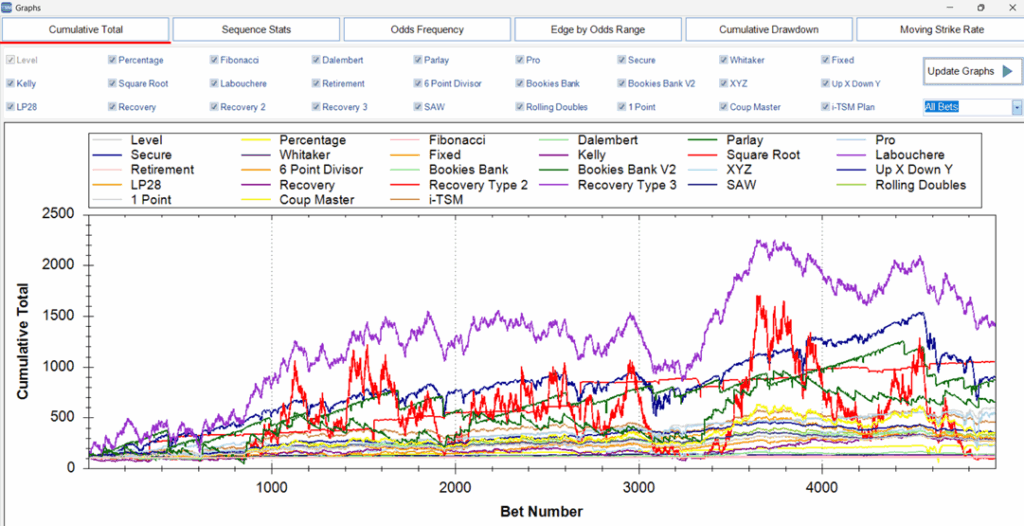
You can view and customize graphs to select and compare just the staking plans you are most interested. The settings of each staking plan can be edited to match your risk level, be it conservative or aggressive.
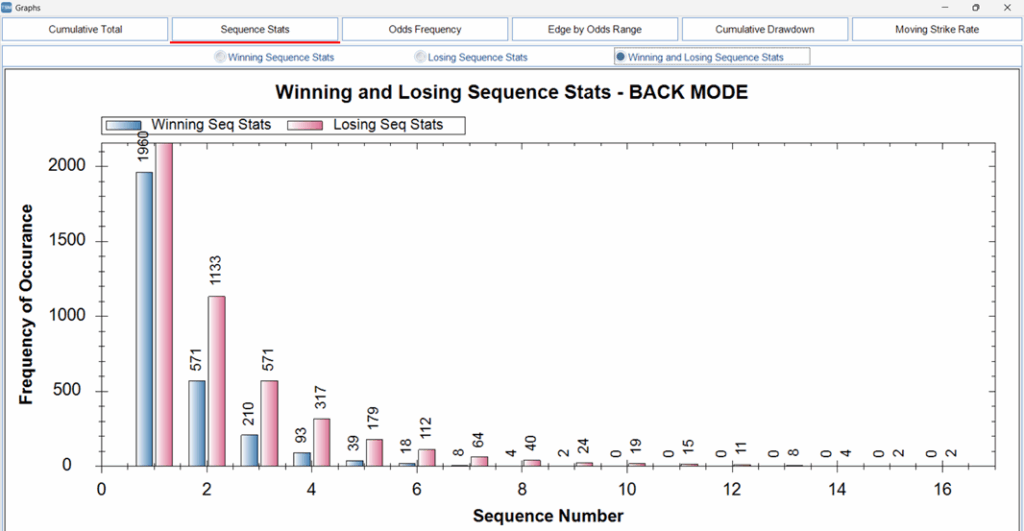
You can see key characteristics such as winning and losing sequences
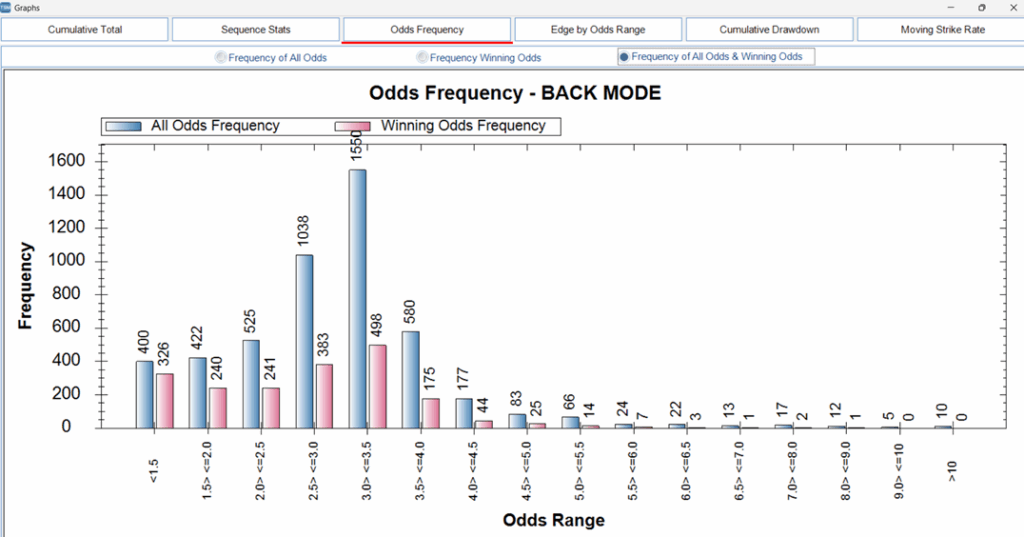
You can see the frequency of all odds and winning odds to get a better understanding of the nature of the betting strategy.
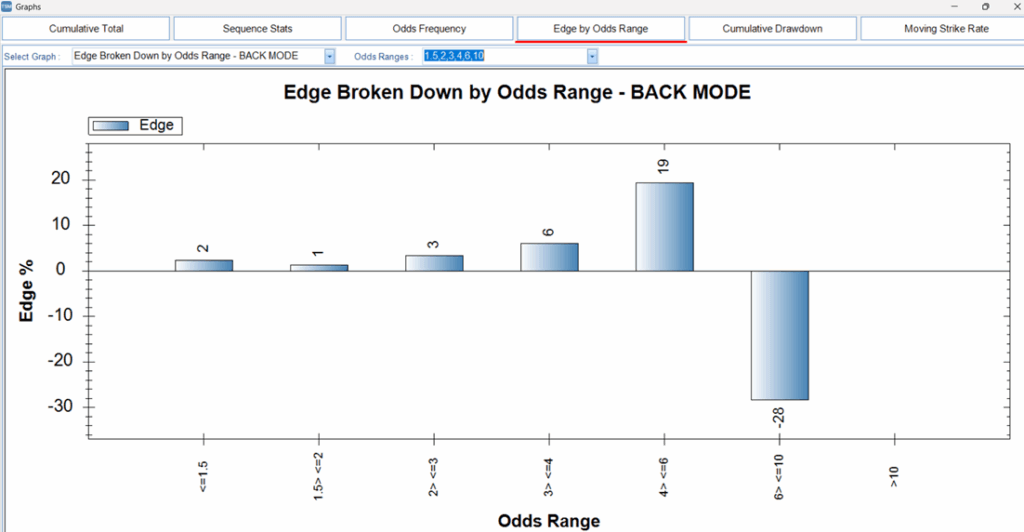
You can also see the strategy edge (yield/ROI) broken down by custom odds ranges. This is a great way to see if there are odds bands you should cut out or focus on. There are several choices of pre-made odds ranges and you can also make your custom ranges to analyze. Being able to visualize this data can speed up your strategy optimization process.
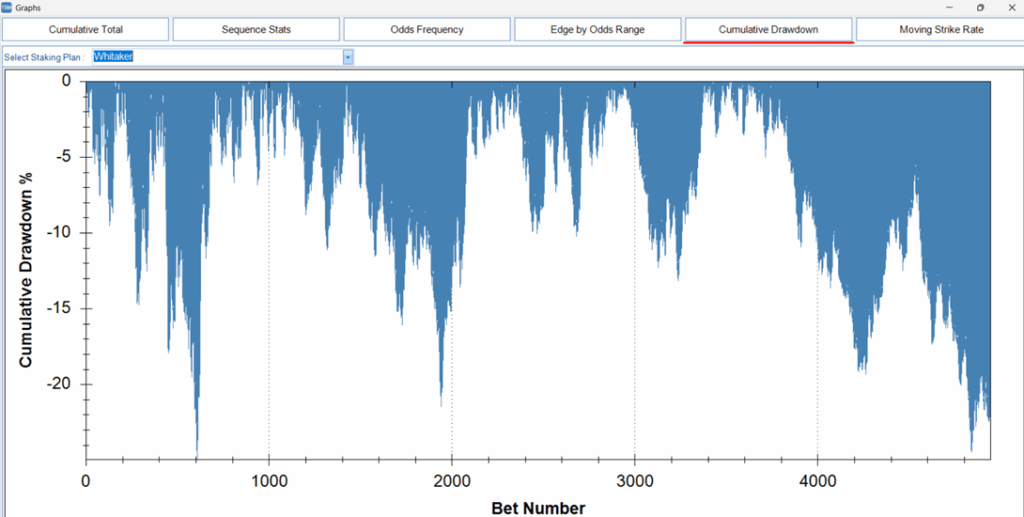
You can also see the frequency and depth of drawdowns for each staking plan. Knowing the Maximum Drawdown is useful, but being able to see the number of times large drawdowns came is useful, too.
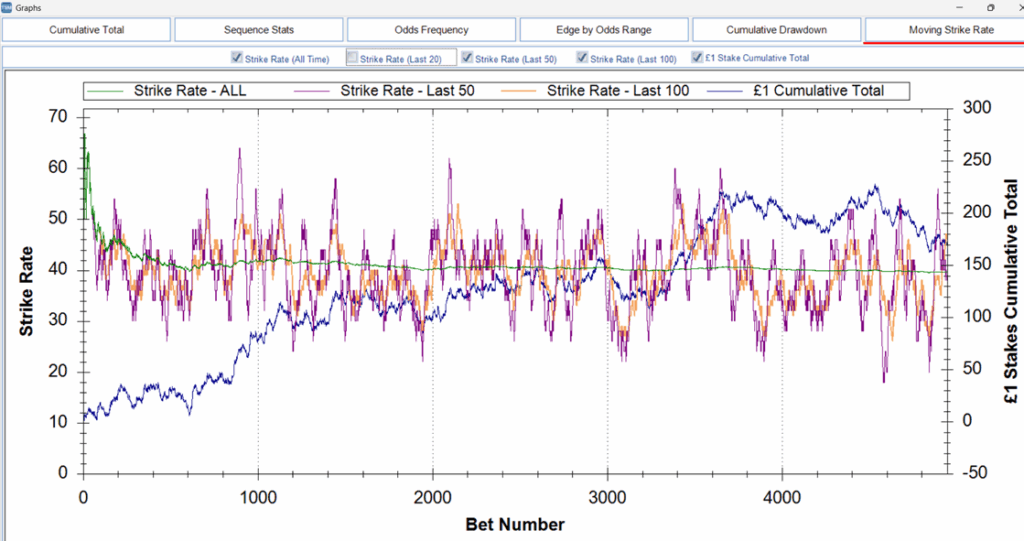
You can also see the short and long term win rates (strike rate) put into a graph. This really helps you visualize the volatility or consistency of your strategy. You can see the win rates for the last 20, 50 or 100 bets. Value betting needs a long term mentality and the ability to stay on plan during the many periods of short term variance. If you can see how those waves of volatility of winning and losing runs came in the historical results, then it helps us mentally prepare for similar runs in the future. This is a very, very important chart to view. It can show us that our long term 40% win rate has short term positive variance periods of as much as 60% wins in the last 50 bets or even as low as 18% wins in the last 50 bets. Some people might abandon the strategy at that 18% win rate, or aggressively increase stakes above safe levels after that 60% win period. We can also see long periods of 500 bets where the short term win rate is below the strategy average. It does not mean the strategy does not work. It is just statistics, probability and the natural law of numbers at work. This chart is a great way to see that volatility over time, and how if we stick with the plan through those periods, we can reach the long term profit targets. This chart also overlays the 1 unit level stakes profit line over the volatility chart to show the P/L progress. It is a good chart to view.
Apply advanced Monte Carlo Simulations methods to double check
You can use Monte Carlo Simulations to remove “luck of the fixture list” and make sure your chosen staking plan does not go bankrupt. Monte Carlo Simulations shuffle the order of bets. The results are not changed, but the order of the fixture list is changed. This is important since some progressive staking plans, recovery staking plans and those that connect the next stake size to the current bank are all influenced heavily by the luck of the fixture list. Similarly, even with level stakes where 33% of the bets are losers, if most of those losers come near the same time, then the bank could go bankrupt. So Monte Carl Simulations test how the luck of the fixture list can affect the staking plan.
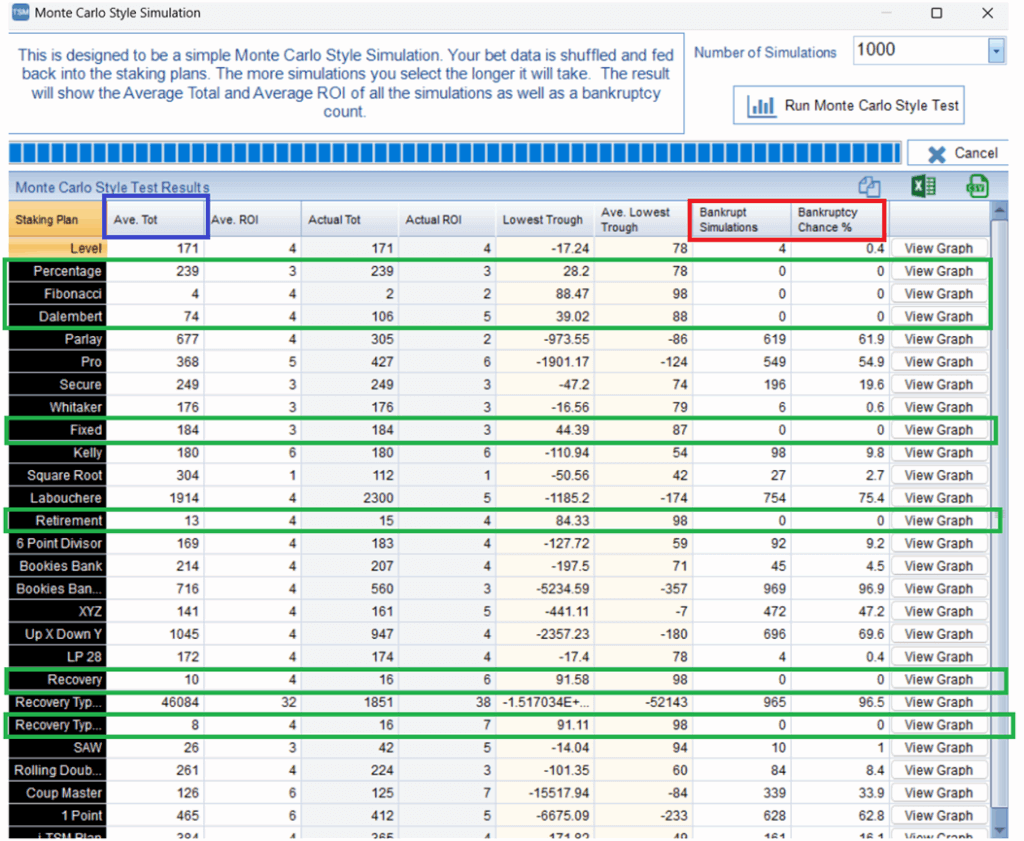
In the above 1000 shuffles, we see more bankrupt cycles appearing, and the safer staking plans for this betting system standing out in green. You can do up to 100,000 shuffles in TSM. The more shuffles you do, the more confidence you can have in your system. But of course, note that if you have a set of 1000 bets with a 33% win rate and you shuffle it 100,000 times, there is a chance that one of those shuffles might have 300 losers in a row. So just because you see 1 bankrupt run in the Monte Carlo Results does not always mean that staking plan was too aggressive. There are cases where extremely bad runs break a bank. If you prepare staking plans that can last a very unlikely 300 bet losing run, then you could end up staking too little on each bet and being inefficient with your betting capital. So it is important to understand what Monte Carlo Simulations do and to use them to give you a staking plan that has less than 5% of cycles ending in bankruptcy and to also look how far negative it did go on that bankrupt run. See the ”lowest trough” and “average lowest trough” for that, and give slightly more weight to the “average lowest trough”.
Apply advanced Profit Taking methods to triple check
Use Profit Taking settings to remove the “luck of one good run” from the staking analysis.
Make sure your staking plan in the short term and the long term and check the risks from periodic stake increases. With one set of results, if it has a big win near the start, then medium size losing runs afterwards will not be noticed. But it is more common that people increase stakes after good runs, so we want to know what happens if we joined a system at any point during its lifetime. Would the bank still have survived and made profit? The Profit Taking Settings on TSM allow us to withdraw an amount of profit each time the bank reaches a target level. If we set the starting bank to 100 and the profit taking target to 200, then we basically reset the bank to 100 each time it doubles itself. In this way, we test what happens to the bank after each winning run that doubled the bank.
In the graph below, we see the sudden drops as the moments when profit was taken.
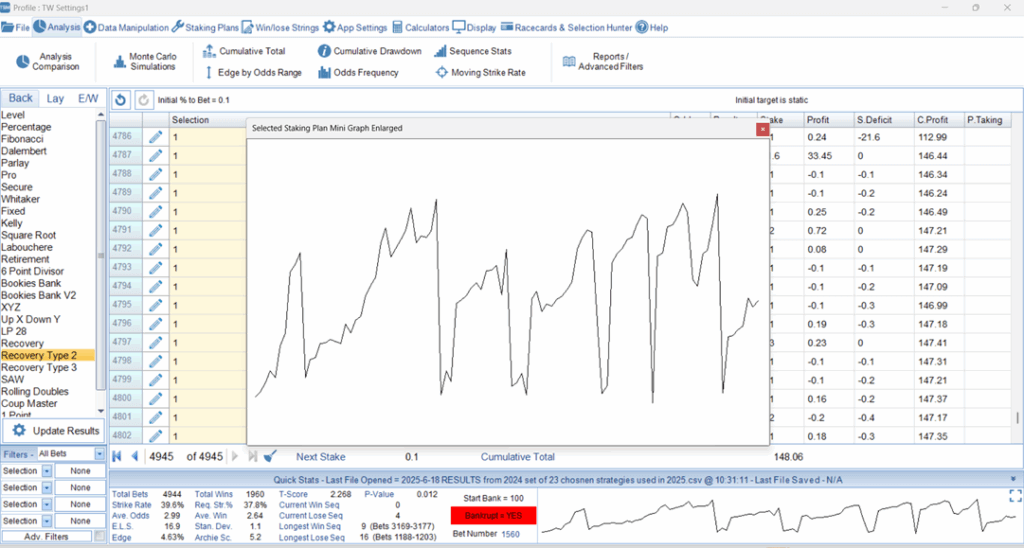
If we then run this through Monte Carlo Simulations, the lowest trough and the lowest average troughs gain even more importance since we have restarted the bank so many times after winning runs. This really tests the strength of the staking plan’s settings.
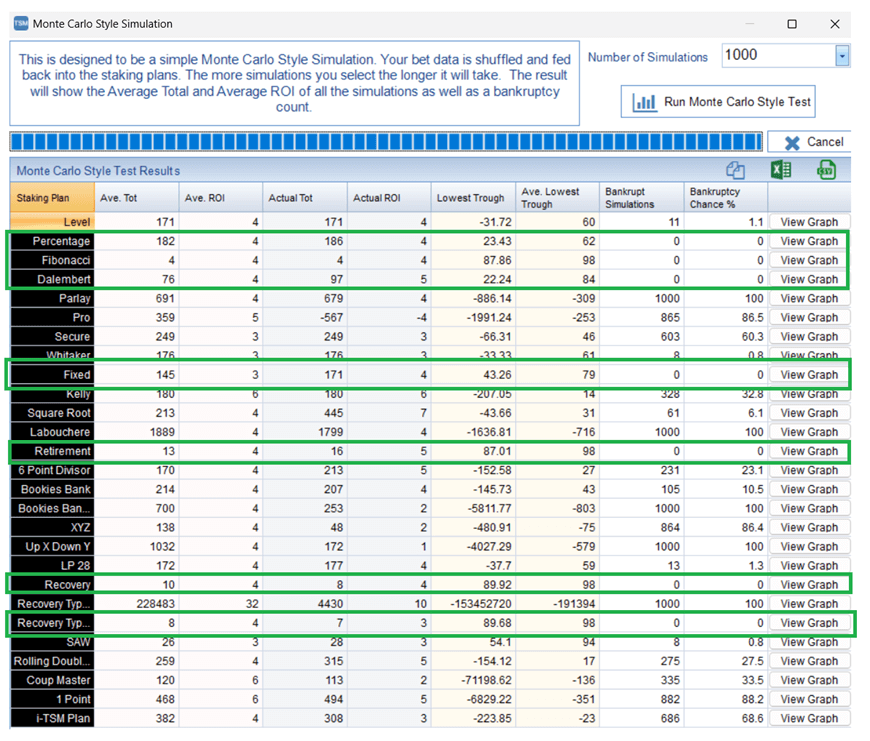
In the table above, we see the number of staking plans with zero bankruptcies reduced even further and we can be really confident that our chosen staking plan settings can help achieve our targets if the historical trend repeats itself.
Recommended Staking Plans
Which staking plans should you focus on in TSM?
We recommend you always test your data with these major staking plans and compare their results with other staking plans you consider.
1 Level Stakes: Betting the same stake on all selections.
2 Whitaker Staking: Betting more on lower odds and less on higher odds in relation to their implied chance of winning and the number of statistically expected losing sequences (ELS) you want your bank to survive.
3 Secure Staking: Betting a different percentage of the bank on different odds bands
4 Target Profit Staking: Betting to win the same amount on all selections. This leads to higher stakes on low odds and lower stakes on high odds.
5 Other custom staking plans
If you have bet data, then a custom staking plan could improve your results.
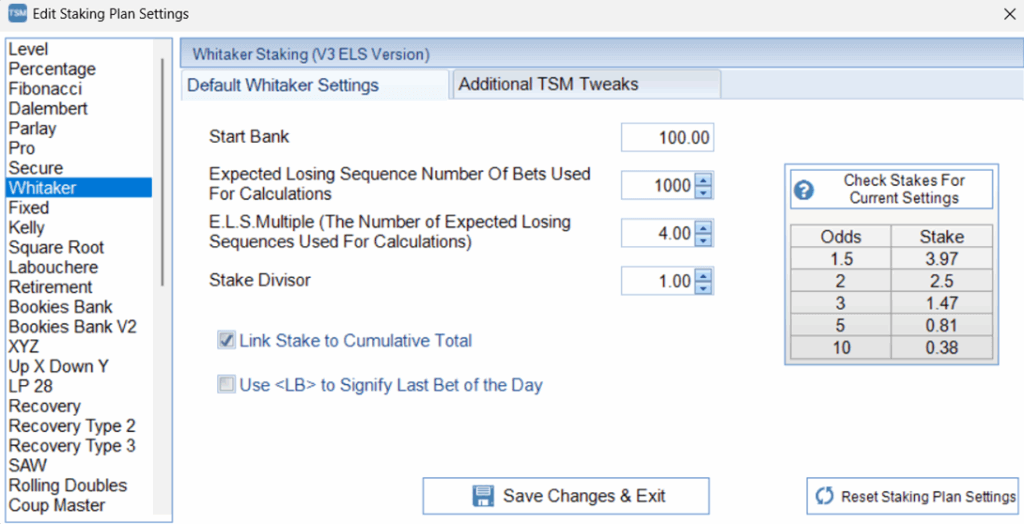
TSM now includes the latest ELS based version of Whitaker NLC and LC staking so you can easily compare Whitaker Staking to Level Stakes, Percentage Staking, Target Profit Staking and many more. (Currently TSM has 45 staking plans included.)
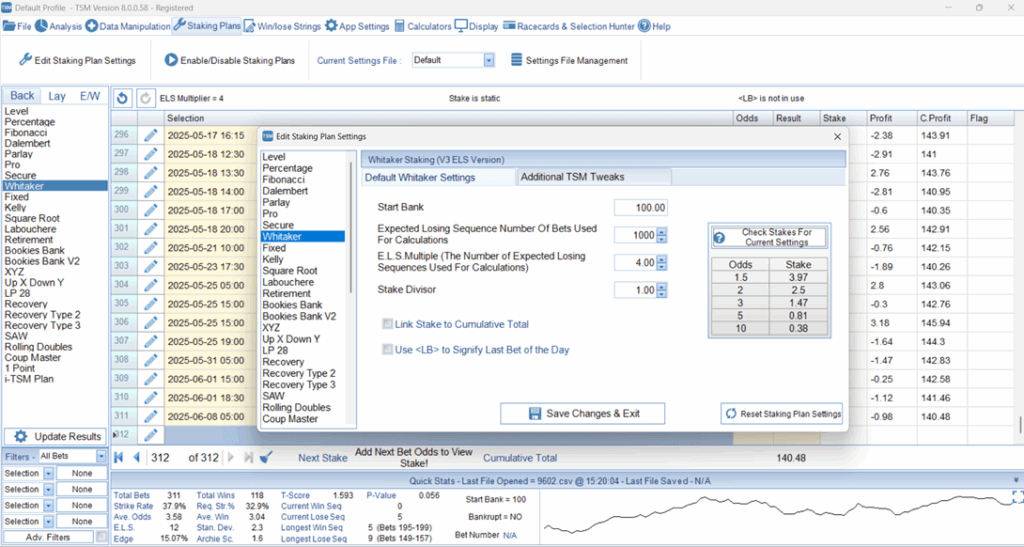
The Whitaker Staking settings are fully customizable. You can edit the ELS, the bet number, the divisor and select NLC or LC using the “Link stake to cumulative total” checkbox.
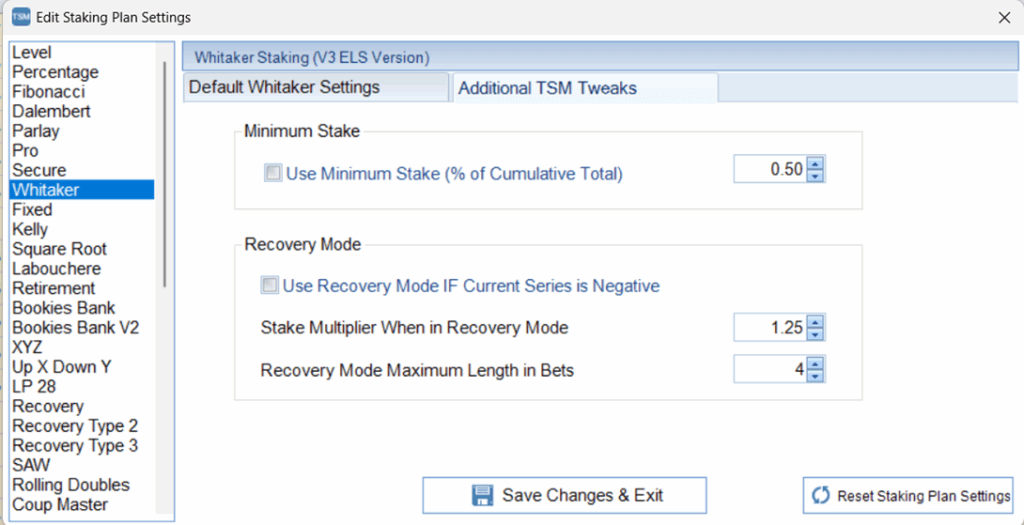
TSM has even added in their own options based on their years of experience in the staking field.
You can set a minimum stake and even add a recovery mode!
You can import historical strategy results from Betaminic.
This is the MUST have software for serious bettors who work with historical bet data.
Just £3.33 per month with a 12-month subscription, an absolute bargain for what it does.

Overview of How to import your Betaminic strategy data to TSM
- Download the data of your chosen strategy as CSV file.
- Import the file to TSM.
- Select the columns with the selection name, odds and win/lose string. (Use the P/L column as the win/lose string.)
- Tell TSM how to recognize your win/lose string. e.g. a win is equal to “Win”
- Save as TSM file for easy loading next time.
Detailed Instructions of How to import your Betaminic strategy data to TSM
1. Download the data of your chosen strategy as CSV file.
In the Public Strategies page, left-click the “Download” button to get all the past data of the strategy back to 2012.
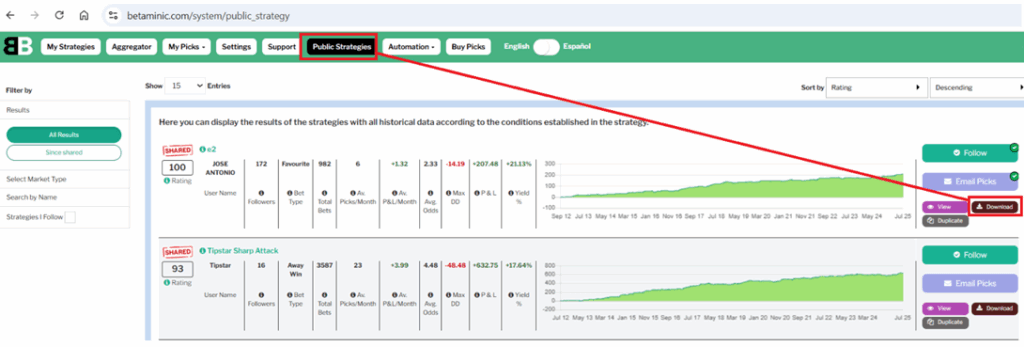
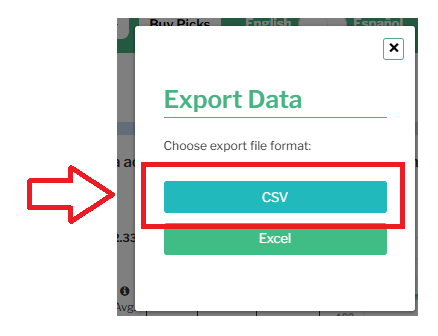
Export the data in CSV format. (Choosing Excel would give you an excel file with two tabs. One tab with the Upcoming Picks and a second tab with Past Picks.)
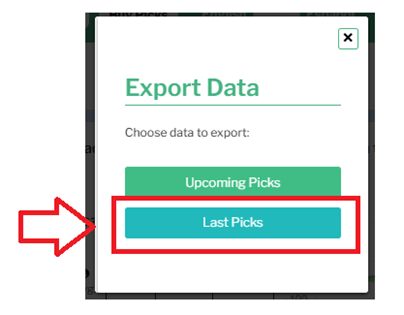
Choose “Last Picks” to get all the historical bet data.
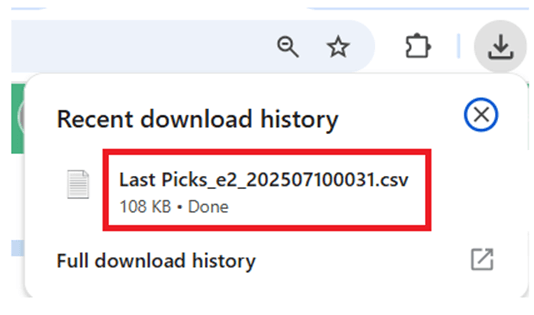
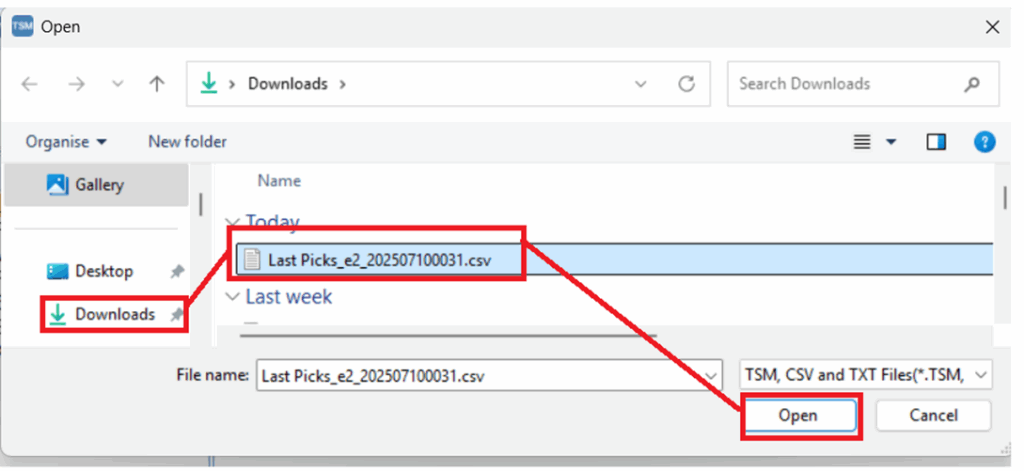
The file will most likely be downloaded to your downloads folder.
The file name will say “Last picks”, then the strategy name, and then the date and time that the data was downloaded. e.g. Last Picks_e2_202507100031 means the data was downloaded 2025/07/10 at 00:31 (12:31 AM).
Please note that private strategies in your “My strategies” area have a limit of only being able to download the last 150 bets of data. If you want to download all the historical bet data from a private strategy, please share the strategy to the Public Strategies page and then download the bet data. If you are unable to share the strategy since it does not meet the “share strategy requirements” of a minimum of 11 bets per month, over +5% yield etc, or if you want to keep the settings private, then please email us to ask for the private strategy past data and we will send it to you manually.
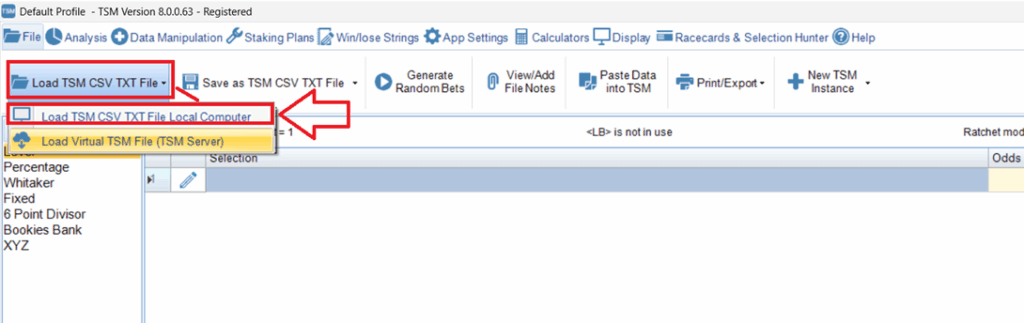
2. Import the file to TSM.
Click “Load TSM/CSV/TXT file” and select your file from the downloads folder.
3. Select the columns with the selection name, odds and win/lose string.
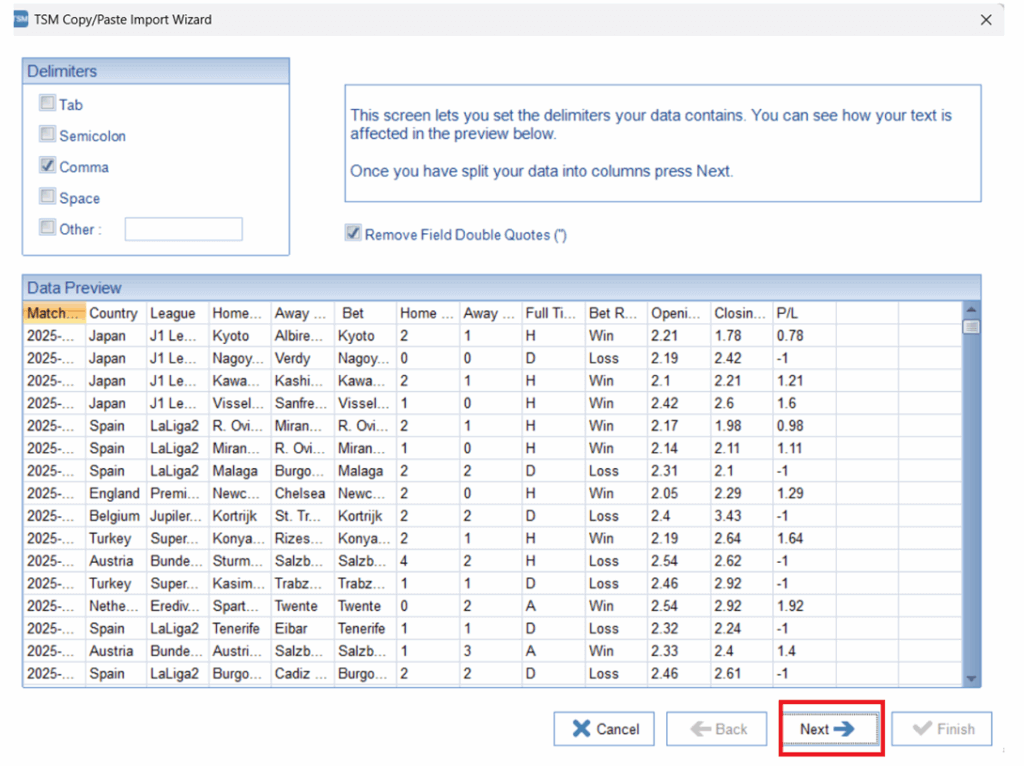
On the first screen of the import data wizard, click “Next”
On the second screen of the import data wizard, choose the key data to import into TSM.
Choose columns 1, 12 and 10.
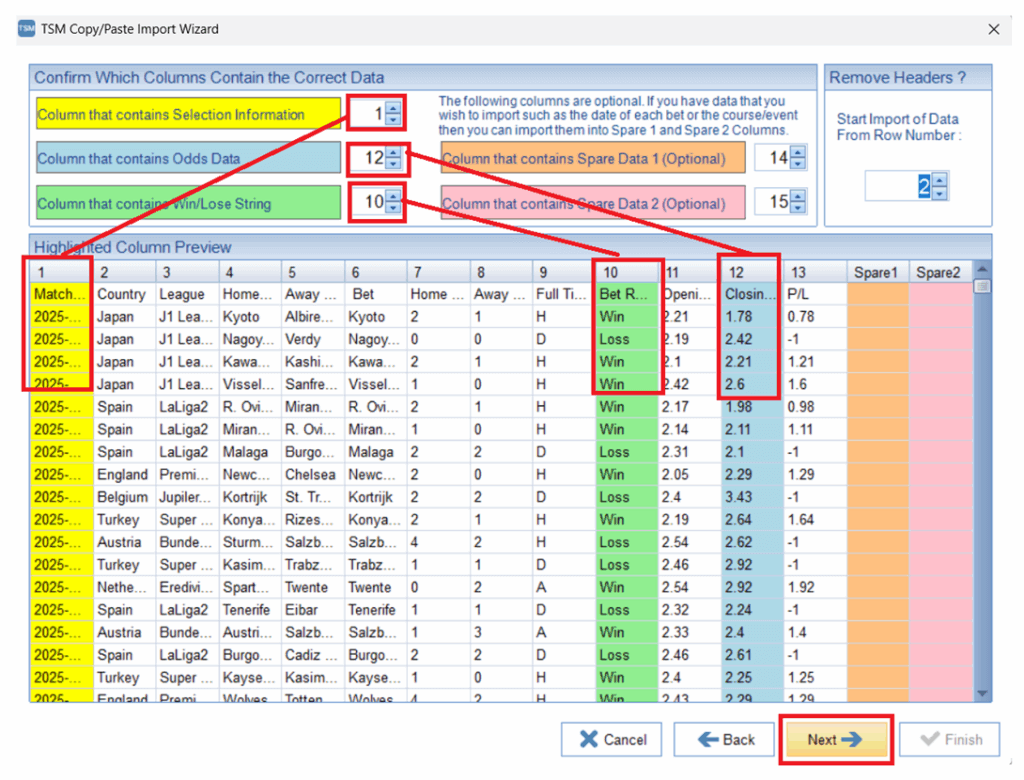
Choose column 1 as the Selection Information. It is simplest to use the date, so you know that your data is in order, but you can use the league or bet selection, too. It is up to you and does not affect the actual staking analysis calculations.
Choose column 12 as the Odds Data. These closing odds are used as the reference to calculate the P/L in the Betamin Builder.
Choose column 10 as the Win/Lose string. This tells TSM if the bet won or lost.
There are 2 more optional data columns if you want to include leagues or the bet selection. It is up to you and does not affect the actual staking analysis calculations.
After selecting columns 1, 12 and 10, click “Next”.
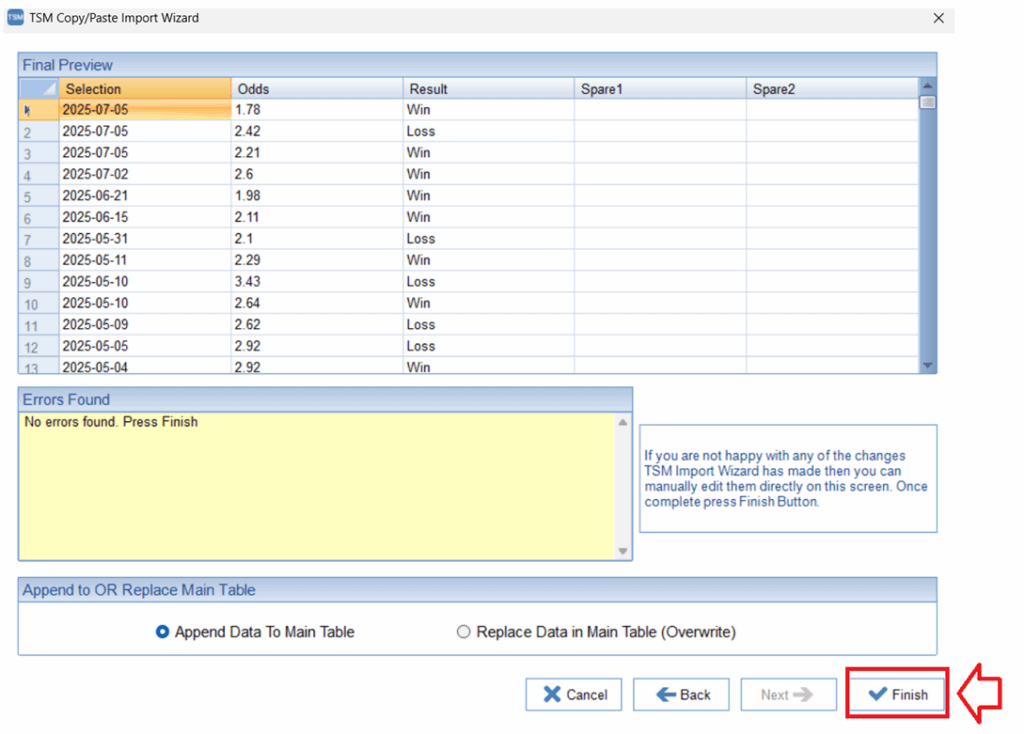
On the third screen of the import data wizard, click “Finish”
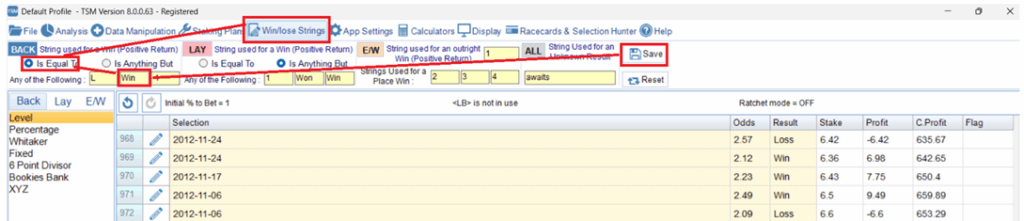
4. Tell TSM how to recognize your win/lose string.
Go to the “Win/Lose String” screen.
Select String used for a win “Is Equal To” “Win”. You will need to edit the yellow cell so that the text reads “Win.” Then click “Save”.
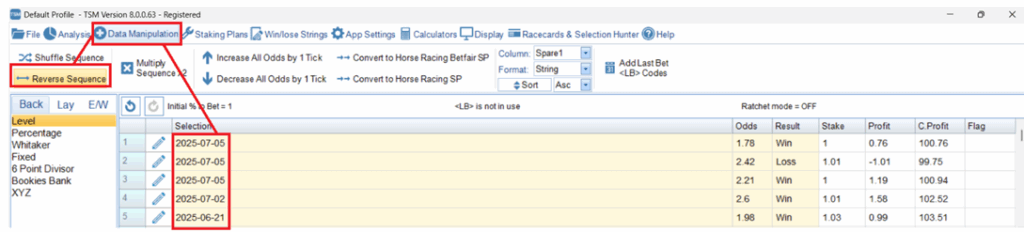
If you notice that your data is in the wrong order (new to old), then go to the Data Manipulation screen and click “Reverse Sequence”. The bet data will now be in the correct order of old to new bets.
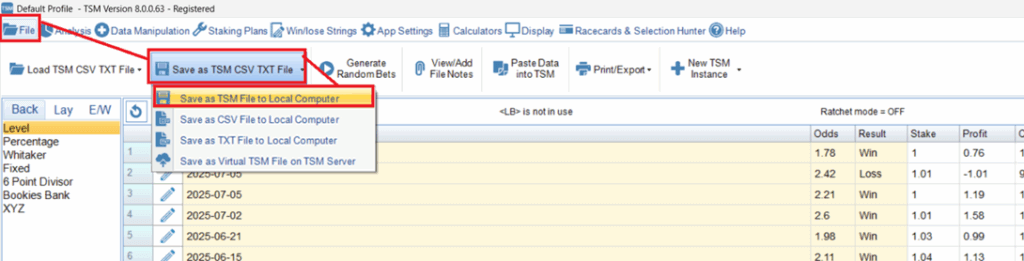
5. Save as TSM file for easy loading next time.
If you might come back to the data again, then you can save time by saving this imported data as a TSM file. Then you will not need to go through the import wizard again.
If you have never used TSM, then try the demo and be amazed by what it can show you about your betting systems.
Click here to go to The Staking Machine website now.
Sign Up for free to access the Betamin Builder here.
Read more about The Staking Plans Book
See more Betaminic Books here including a free eBook.
See the best betting systems ranked by profit, ROI and risk here.
Read more about the free Betaminic Public Strategies here.