The Staking Machine – The Best Analysis Tool for your Betting Systems
We can find the best betting strategies on Betaminic, but how can we improve our strategies? What staking plan works best with our betting system to maximize our profits? The Staking Machine can help you find the answers.
Betaminic is a huge database of football data and historical bookmaker odds. We can find out what betting strategies have worked over the past 7 years and take advantage of those winning betting patterns. You can sign up here for free to use this amazing online tool. But once we have our strategies how can we squeeze the most profit out of those strategies without increasing risk? Also, how can I analyze the strategy to understand it better and possibly find ways to improve it further?

![]()
 The Staking Machine
The Staking Machine (TSM) is an amazing piece of software developed by Dave Morris of Crystal Software, a company based in the UK. The program in its first incarnation was written in 2006, but since then, it has been added to and improved on to become the most useful betting system analyzer available. Its ability to analyze large amounts of data and produce a variety of charts, reports and statistics can help Betaminic users to understand their strategies in an even clearer way than before. It also has amazing data manipulation tools that allow you to see how different staking plans would work with your strategy. You can also combine the data from different strategies together to see how aggregated systems perform. It can help us improve our strategies by showing us which odds ranges generate the highest yields and should be focused on and which odds ranges are performing badly and should be cut out.
It can help you answer all these questions:
- How can I make even more profit?
- What is the best staking plan for my strategy?
- How much should I bet?
- When should I take out profit?
- How low did the bank go in its worst run?
- How can I improve my strategy?
- Where is my strategy finding value?
- Should I filter out some odds ranges?
- What are the characteristics of my strategy?
- How often and how long does it have losing or winning runs?
- How many bets does it make in different odds ranges?
- How much would my profits change if got just one tick higher when placing bets?
- Which is better, betting on opening odds or closing odds?
Analyzing Betaminic Strategies with The Staking Machine
Next, let’s look at how we can use this software with Betaminic strategies.
Let’s look at Colossus 3 Free Scoring Favorites. This is one the most successful strategies. It was one of the strategies featured in our “Best of 2019” article here.
Import the Data
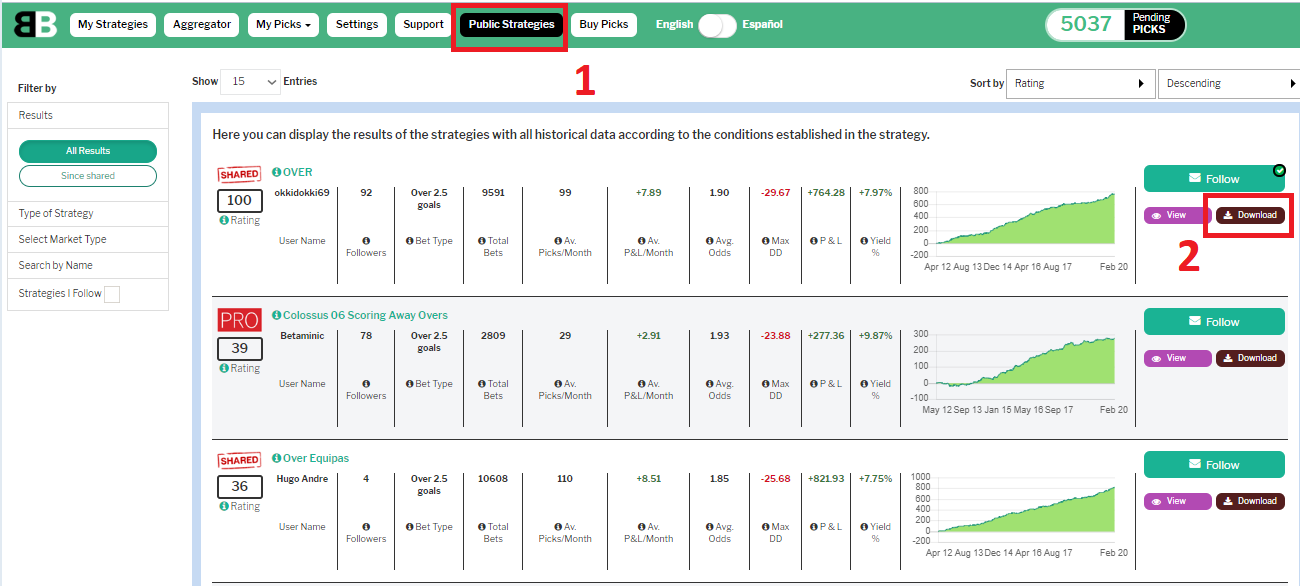
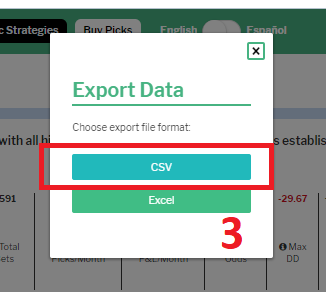
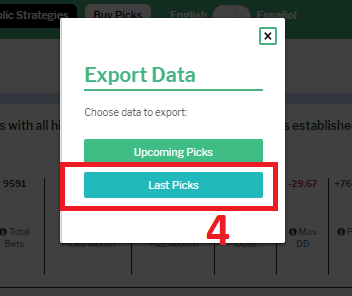
First, we need to get the data to analyze. On the Public Strategies page, on the right of each strategy there is the option to download the data. Click on “Download”, then select “CSV” file as the format to download in, then select “last Picks” to get all the historical picks for that strategy. (Note that you can download all the historical picks for Public Strategies, but only the last 150 picks for private strategies on the “My Strategies” page, so if you have a private strategy that you want to analyze, it is easiest to share it, and then you can download all the historical data from it on the Public Strategies page.)
Next, we need to import that data into the The Staking Machine (TSM) software. It costs 29.99 GBP. You can also download an evaluation version for free, but this only allows a maximum of 10 bets to be analyzed, however it gives you an idea of what kind of software it is.
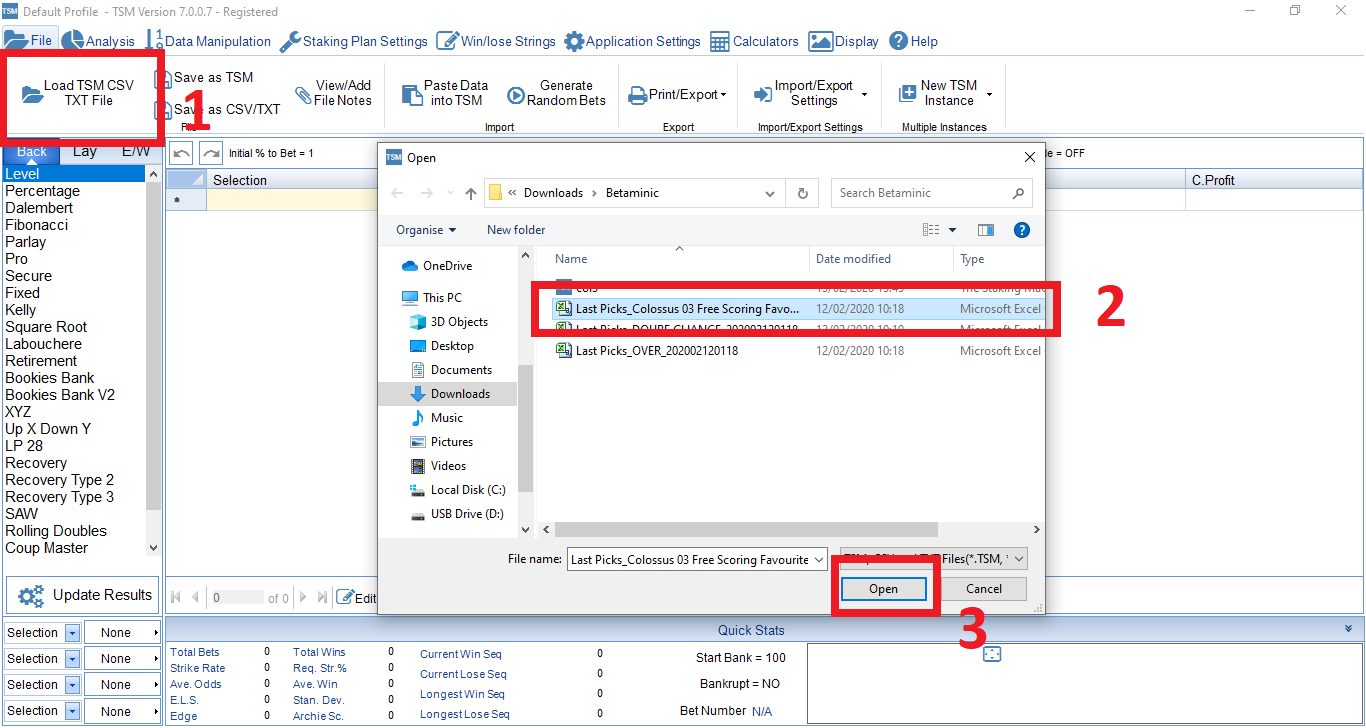
To import the data, we click on “File” then “Load TSMCSV TXT file”. Then select a file from the downloaded data from Betaminic. Here let’s look at “Last Picks_Colossus 03 Free Scoring Favourites_202002120118” This file name tells us it is the last picks, not upcoming picks, and the data was taken on 2020 February 12th (20200212) at 1:18 am (0118).
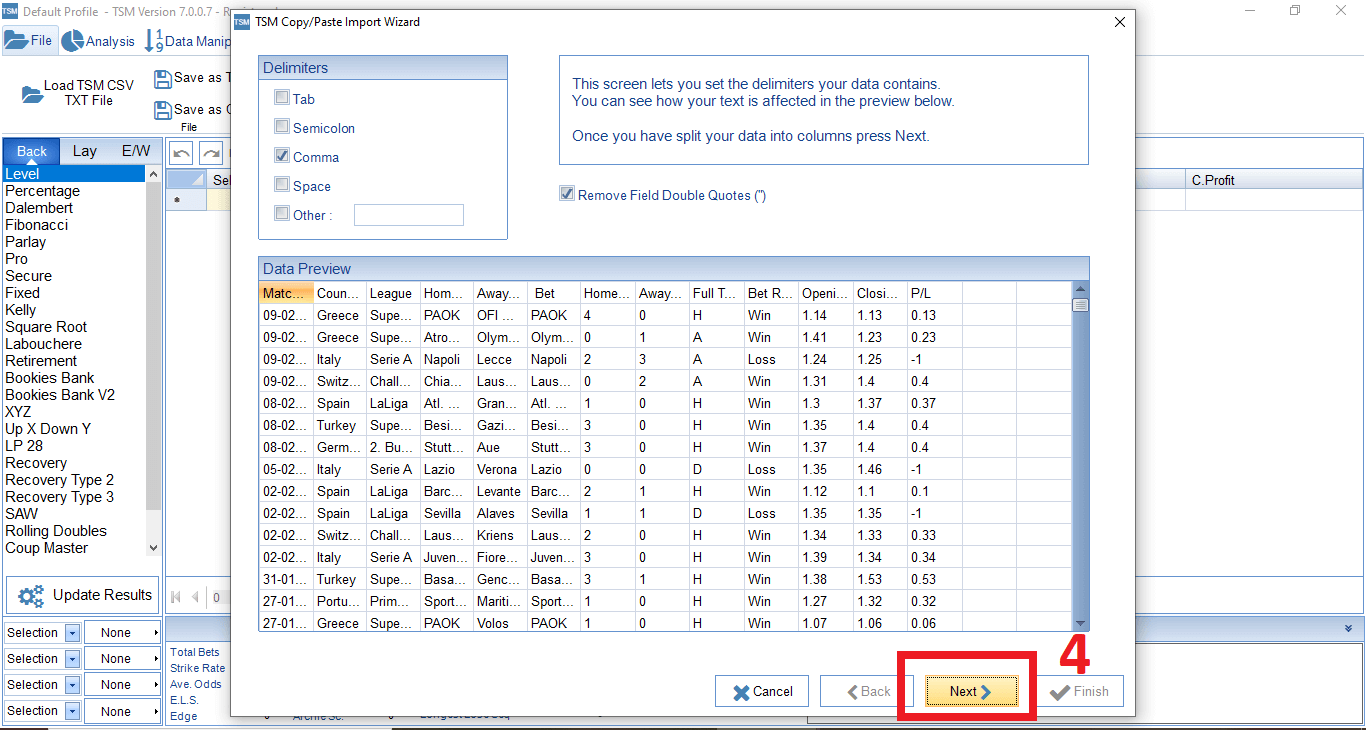
Next the import wizard shows a preview of the raw data. Click “Next”.
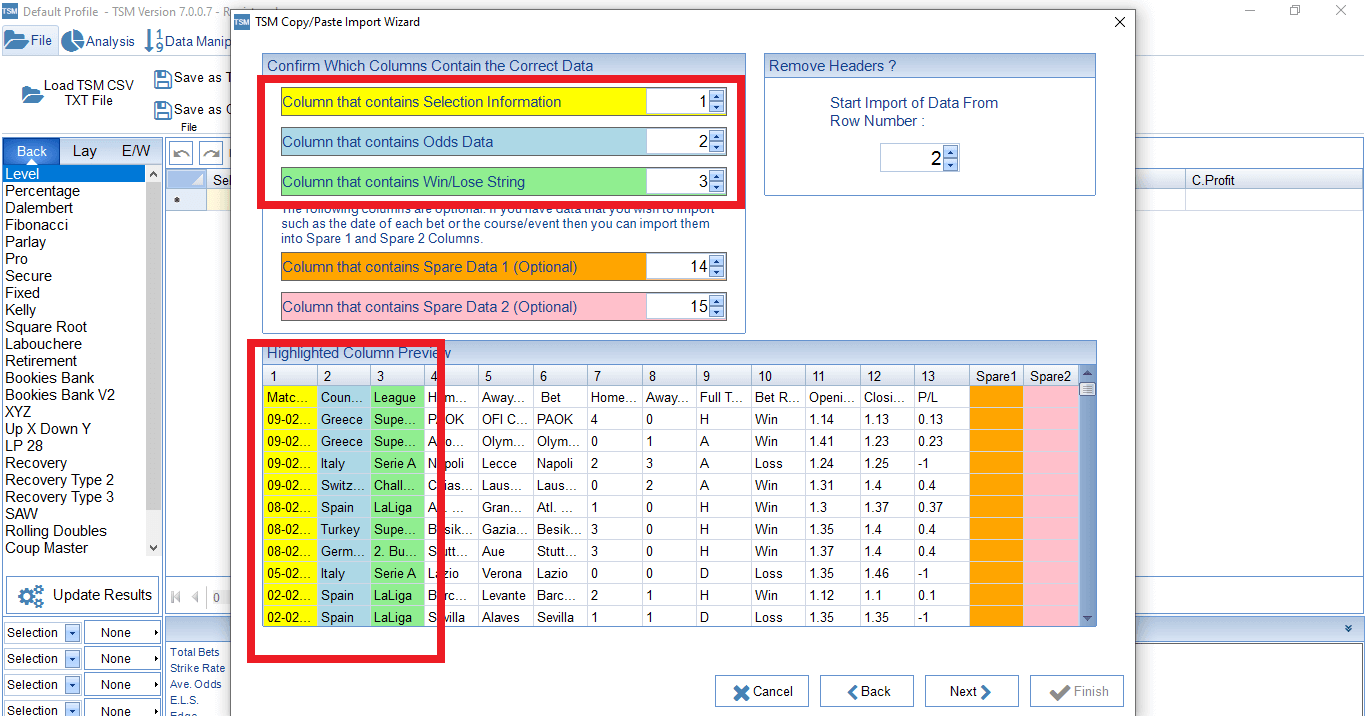
On the next screen we must tell the software which columns have the “Selection Information” (what we bet on), the odds and the “Win/Lose String” (if the bet won or lost).
Click on the up/down arrows for each row until “Selection Information” is on column 6 (the bet column), “Odds Data” is on column 12 (closing odds) and “Win/Lose String” is on column 10 (bet result). Then click “Next”.
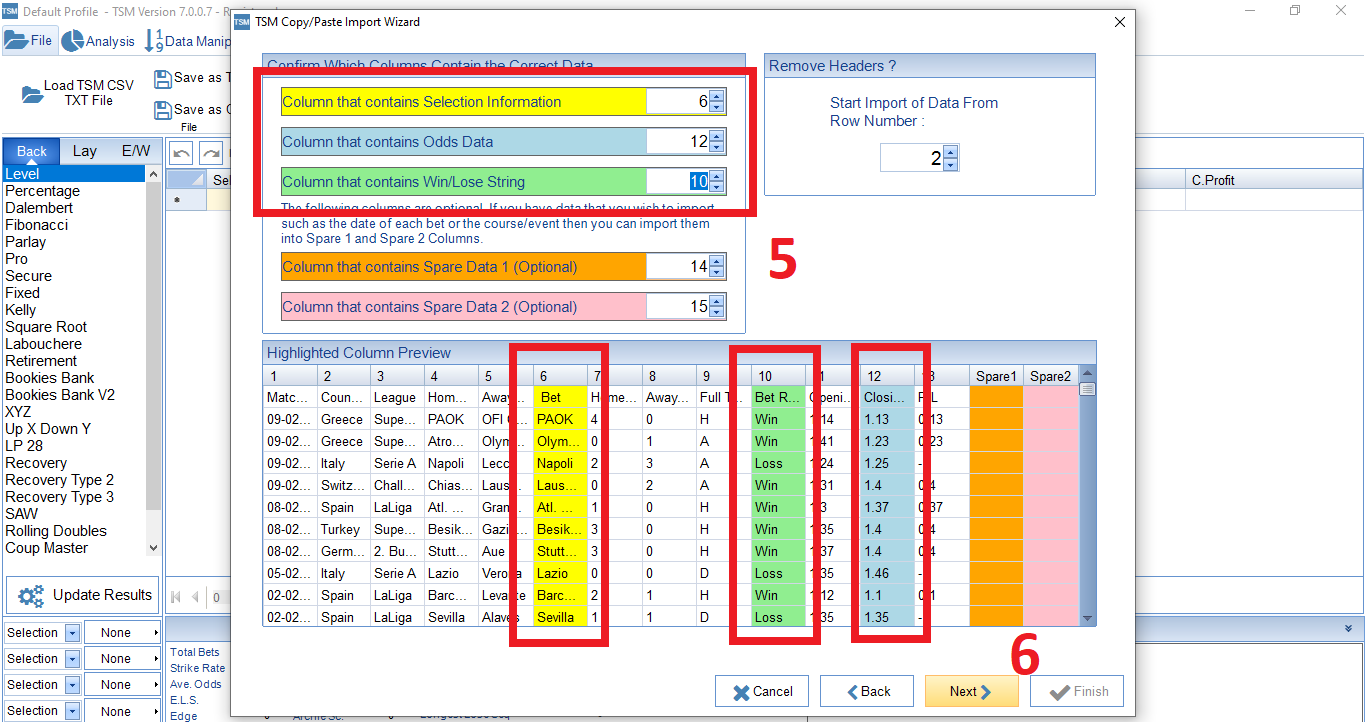
We can now see the key data has been found.
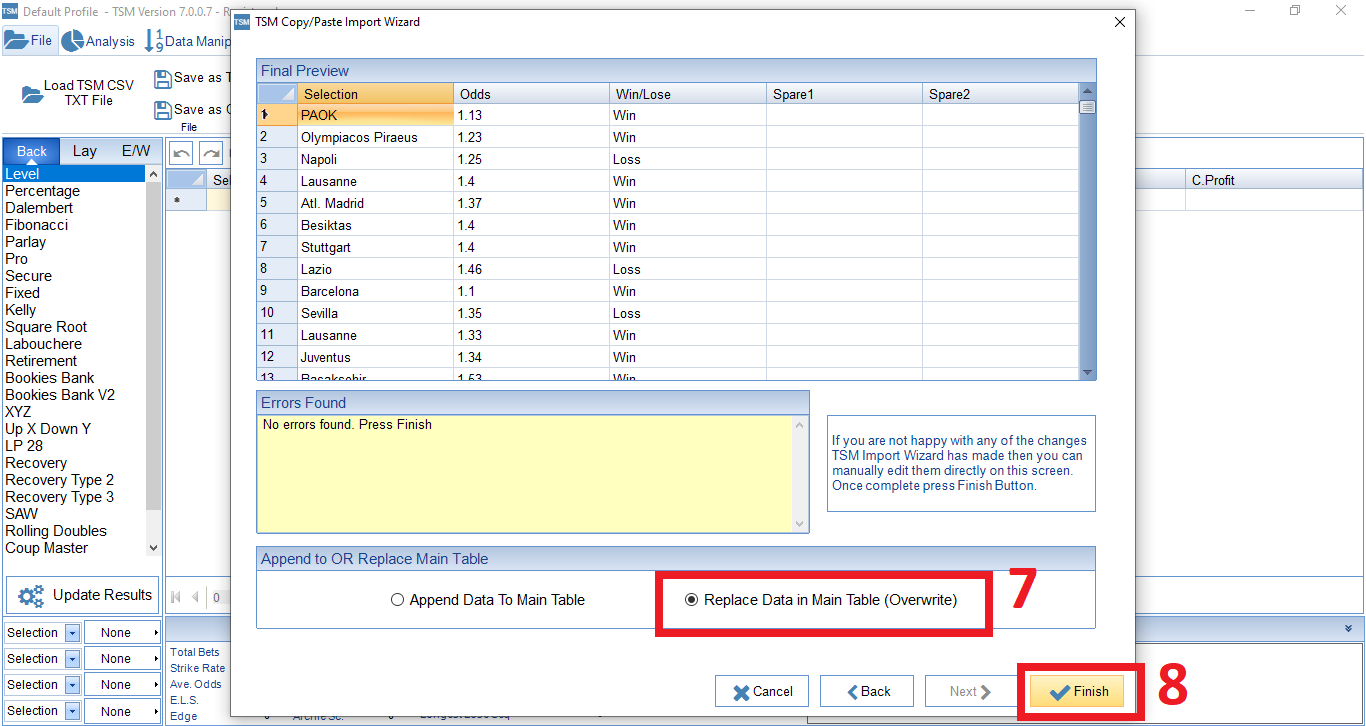
We then click on “Finish”. (If you are combing the data from different strategies together, you should select “Append Data To Main Table”. If you just want to analyze this one strategy’s data, select “Replace Data in Main Table”)
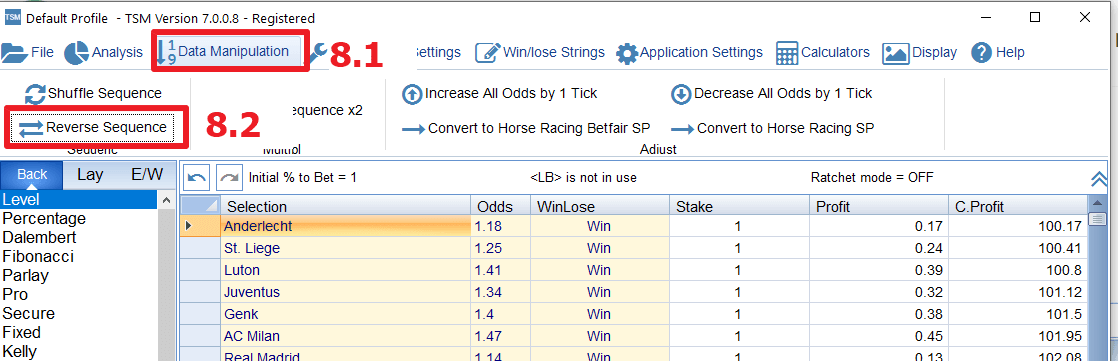
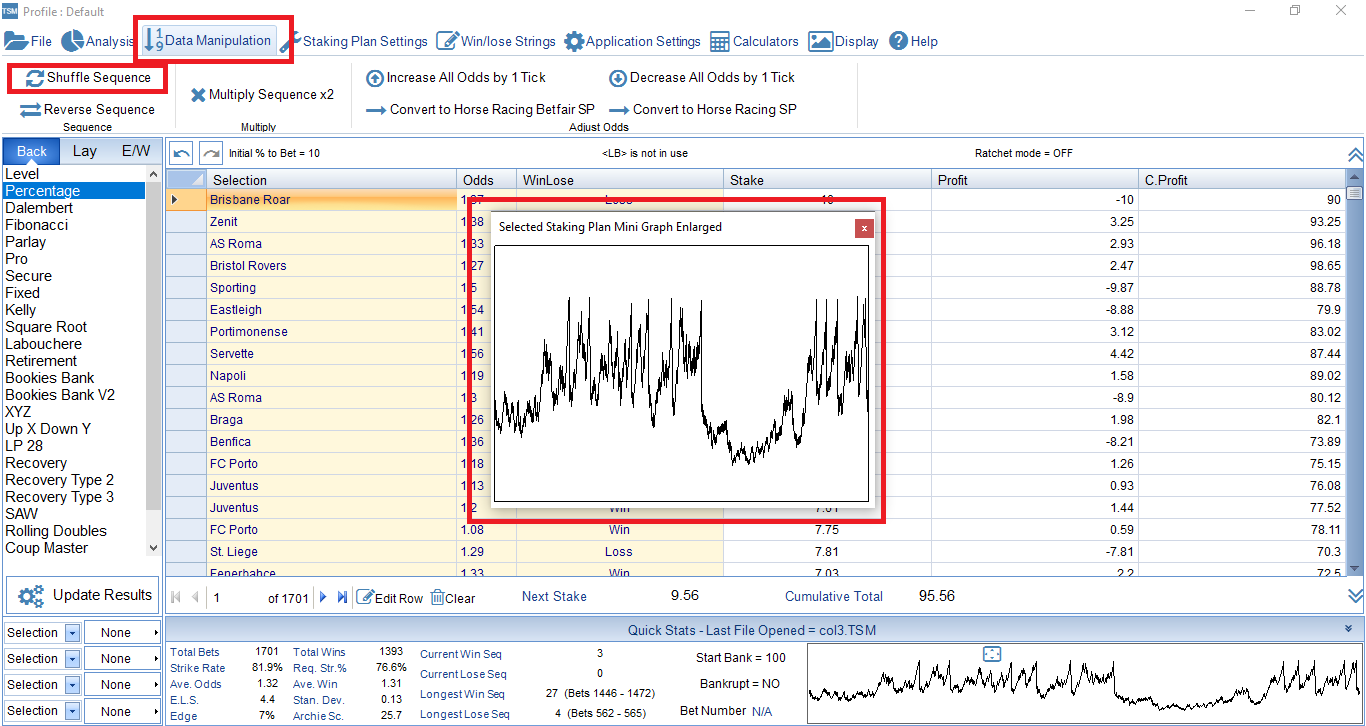
The data in the picks file is sorted by most recent date, but to perform the simulations we need to sort it by the oldest date, that is, the first pick is equivalent to the first date. To do this, we click on “Data Manipulation” and then on “Reverse Sequence”. In this way, the first pick equals the oldest date and our data will be sorted correctly.
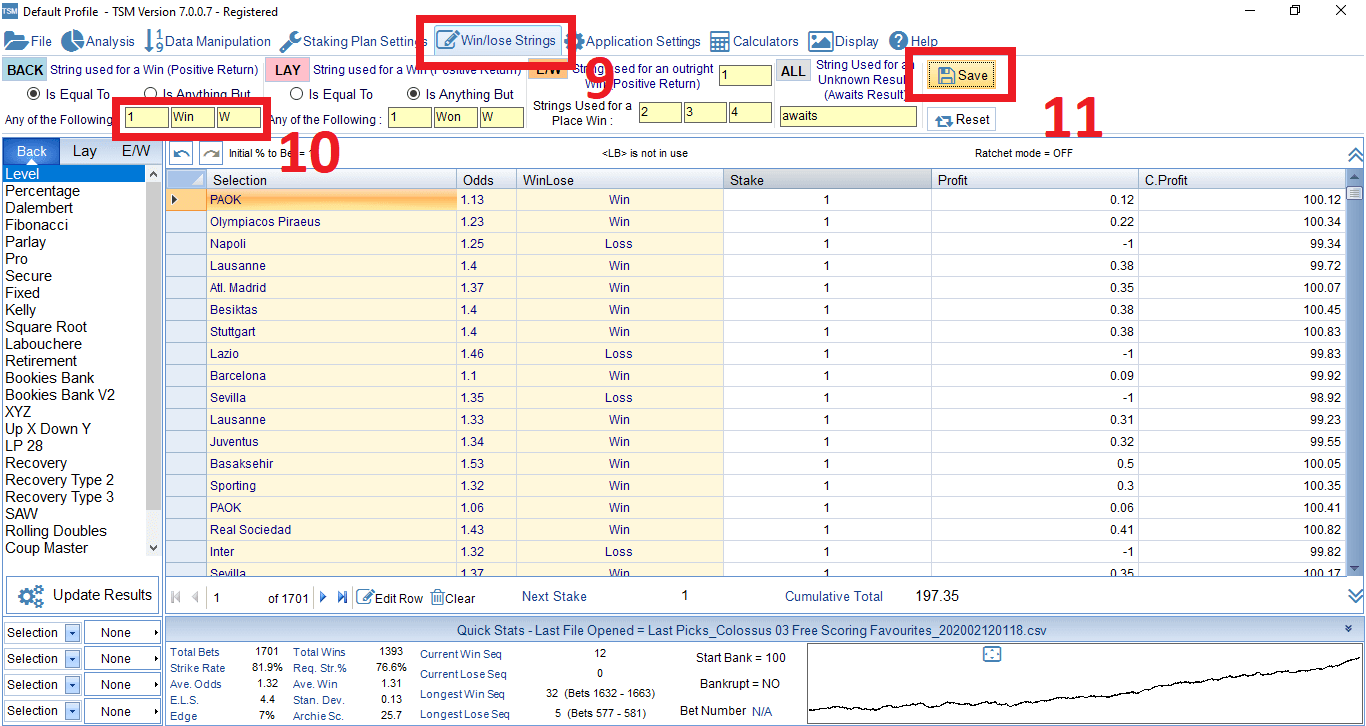
Then we need to click on the “Win/Lose Strings” tab at the top. Then, edit the “BACK String used for a win” yellow box area from “Won” to “Win” so that it matches the Betaminic data, and click “save”.
View Key Data
Now we have our data ready to analyze. We can see here that this strategy has had 1,701 bets (Total Bets) and 1,393 bets won (Total Wins). That is 81.9% bets won (Strike Rate).
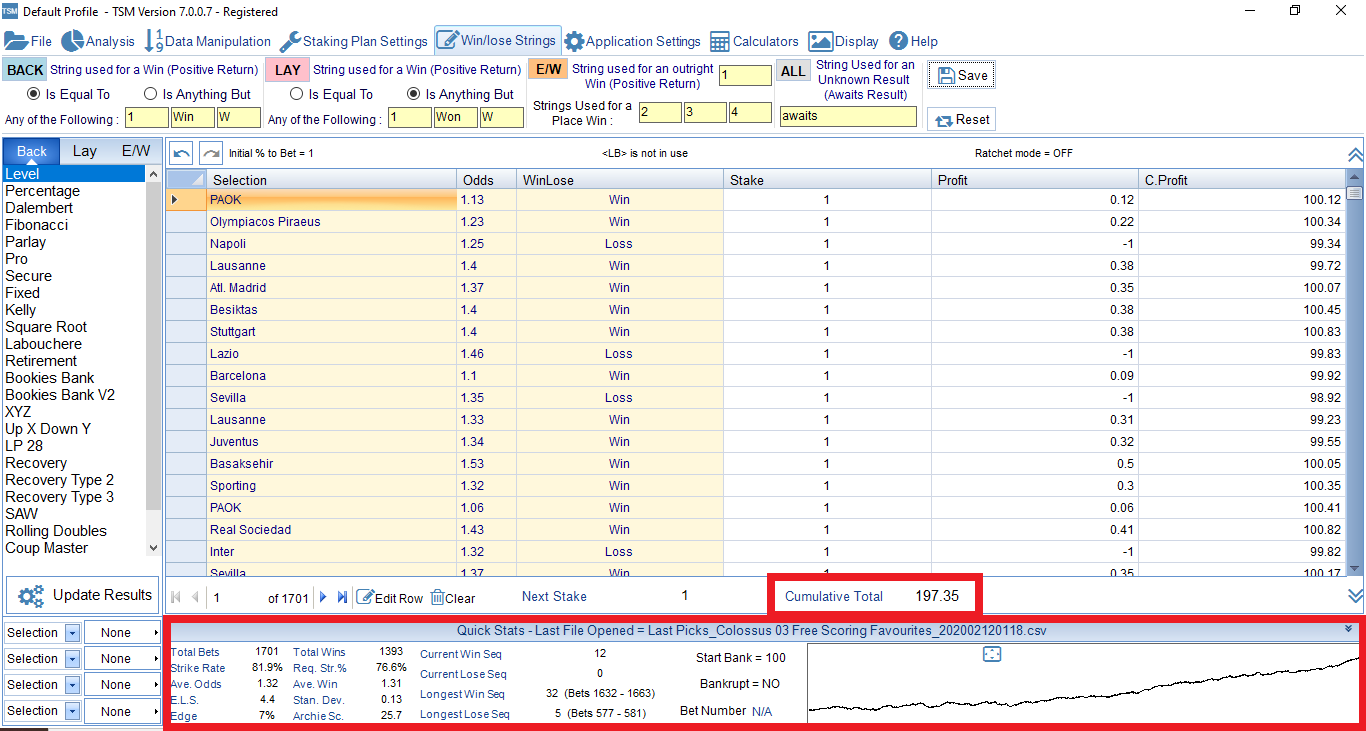
Next we get some new and interesting information. The “Req. Str. %” is the required strike rate to break even. That means we need to get 76.6% of our bets to win in order to avoid a loss.
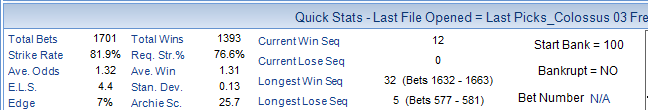
The average odds bet on were 1.32 (Ave. Odds) and the average odds of the bets that actually won were 1.31 (Ave. Win).
The next number is very important for us, it is the Estimated Losing Series (E.L.S.). This number is based on our average odds and the number of bets in the data. This suggests that we should expect a losing streak of 4.4 bets in a row at some point. We can round this up to 5. So that means we should not be surprised if we lose 5 in a row, we should be prepared for it. We should have a betting bank and staking system that is able to survive such a losing streak. Also, two of those losing streaks may come along in a short space of time, so we should have a bank that can last double this ELS for safety. So we should have a bank that can withstand 8 losses in a row. Some even more cautious bettors might choose to make their bank able to withstand 3 or 4 times the ELS.
The standard deviation figure (Stan. Dev.) tells us the variance of the odds from the average odds.
Next, an important figure, is our Edge. This is our yield or our Return On Investment (ROI). It goes by many names. This is how much profit we can expect to make long term per bet.
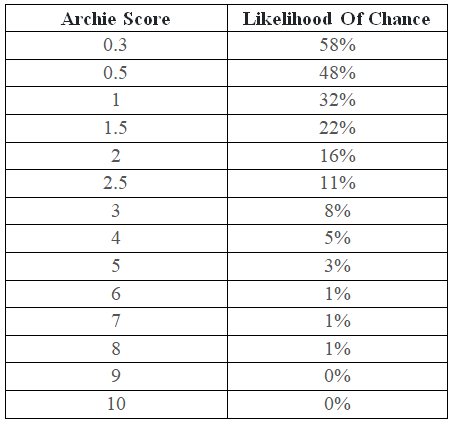
Next, the Archie Score (Archie Sc.) is calculated from a maths formula that tells us how likely these results are down to chance. It is a way of combining the Chi Score (another way of calculating if results are by chance) and Monte Carlo Simulations in one figure. Basically, the higher the figure, the better. If the number is 6 or above, then the chances of the results being down to chance are less than 1%. So the score here of 25 is very good!
Next we can see the current win sequence for this data, which is 12 wins in a row and the current losing sequence which is 0.
We can also see that the longest winning run (Longest Win Seq) was 32 bets in a row which happened between bet No. 1632 and 1663. Also our longest losing run was 5 losses in a row (Longest Lose Seq) which happened between bet No. 577 and 581. This is exactly in-keeping with the ELS (Expected Losing Series) of 4.4.
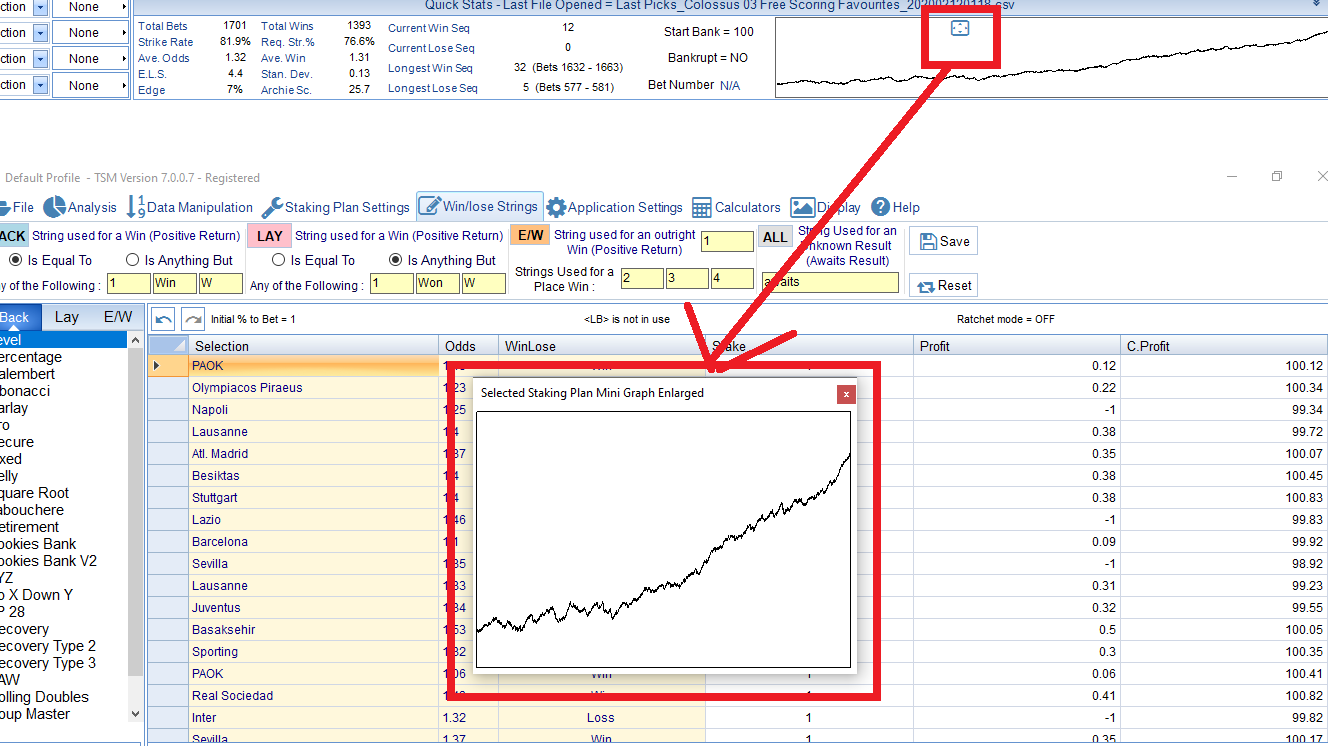
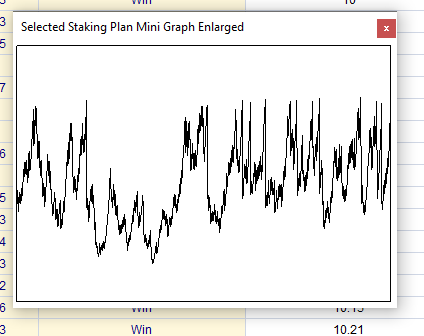
We can also see a graph of the profit progress with the current staking plan which is level stakes. You can click on the small box to enlarge the graph.
These are all just in the “Quick Stats” section of the main page. We can go even deeper into the data and get even more valuable information to understand the nature of this strategy.
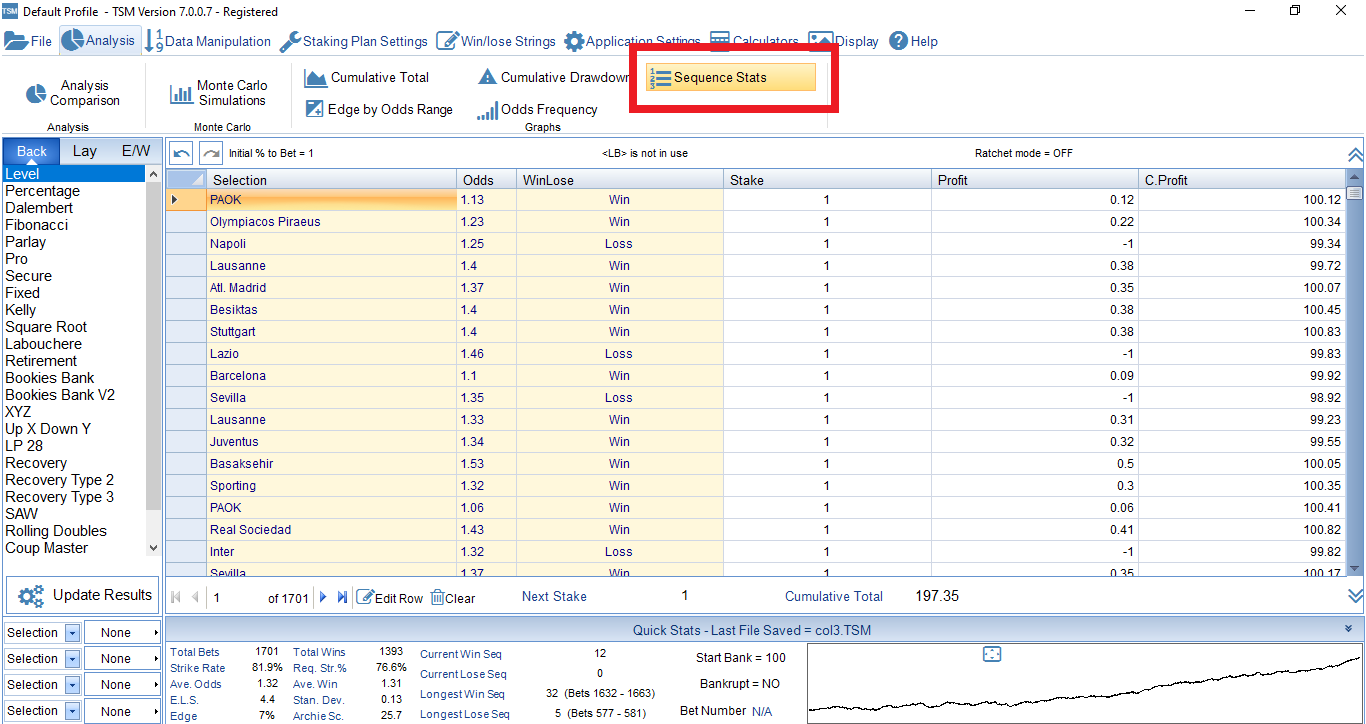
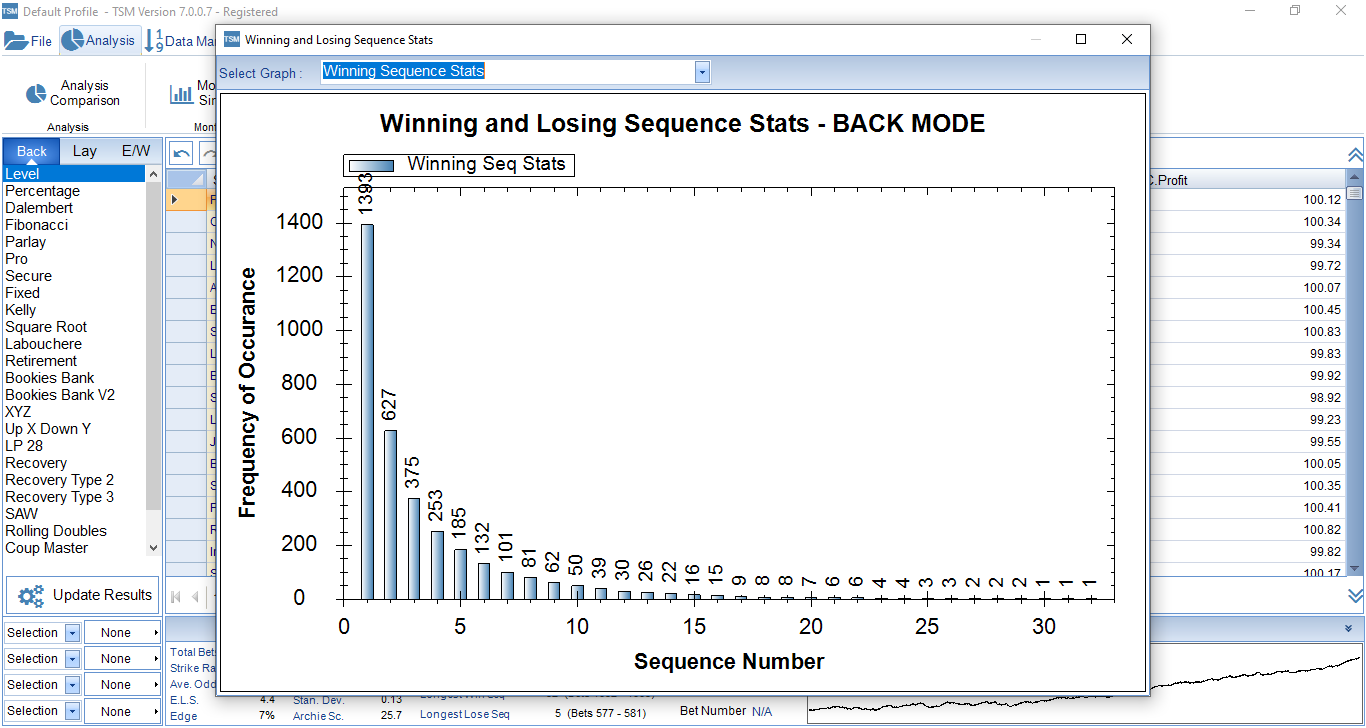
At the top, click on the “Analysis” tab and then the “Sequence Stats” button. We can see the winning run sequences.
Here we can see that this strategy has had winning runs of 30 or more wins in a row on 3 occasions. It has had winning runs of 5 in a row on 185 occasions. And we can see a very smooth, consistent and stable change from short winning runs to longer winning runs.
We can see the Losing Sequences. This is very important in understanding the nature of our strategy and what kind of mental preparation we need. This strategy has lost 5 bets in a row on just 1 occasion, and it lost 4 bets in a row on 2 occasions and 3 bets in a row on 11 occasions.
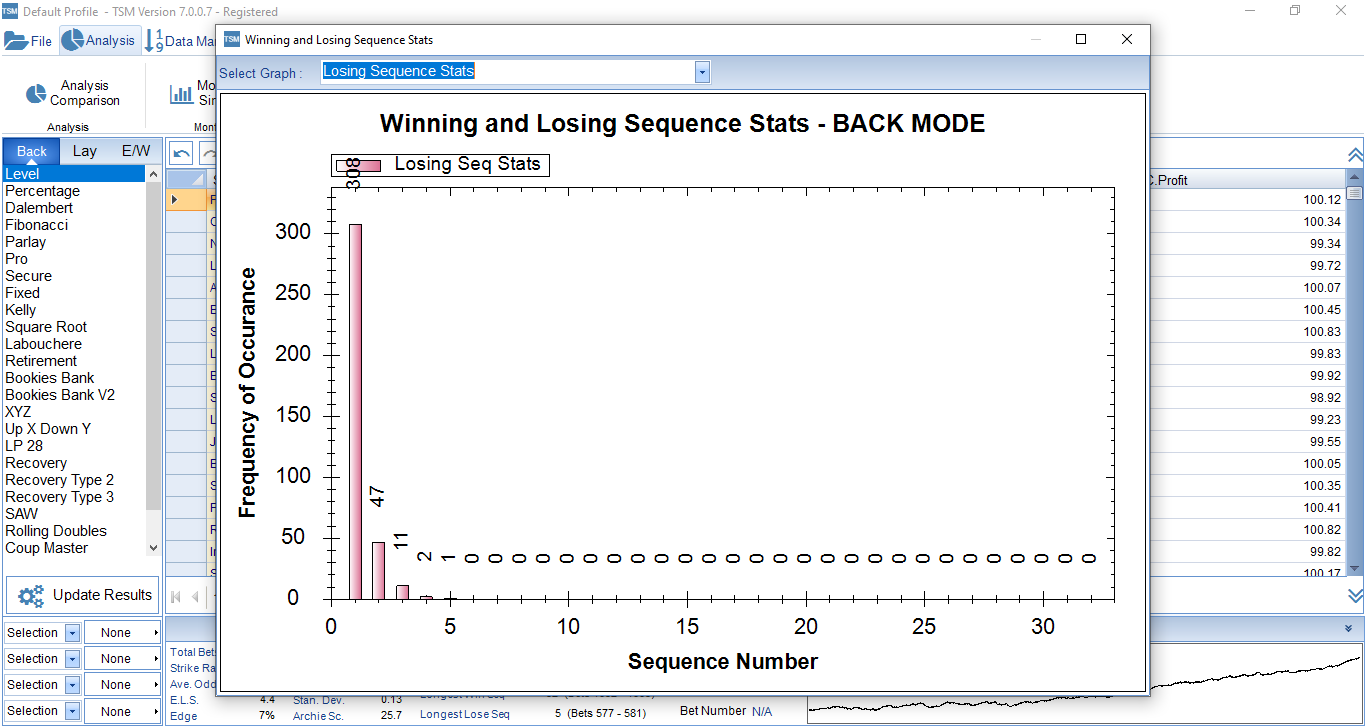
TSM is very useful in the way we can see how many times it has had losing runs and what kind of losing runs they were.
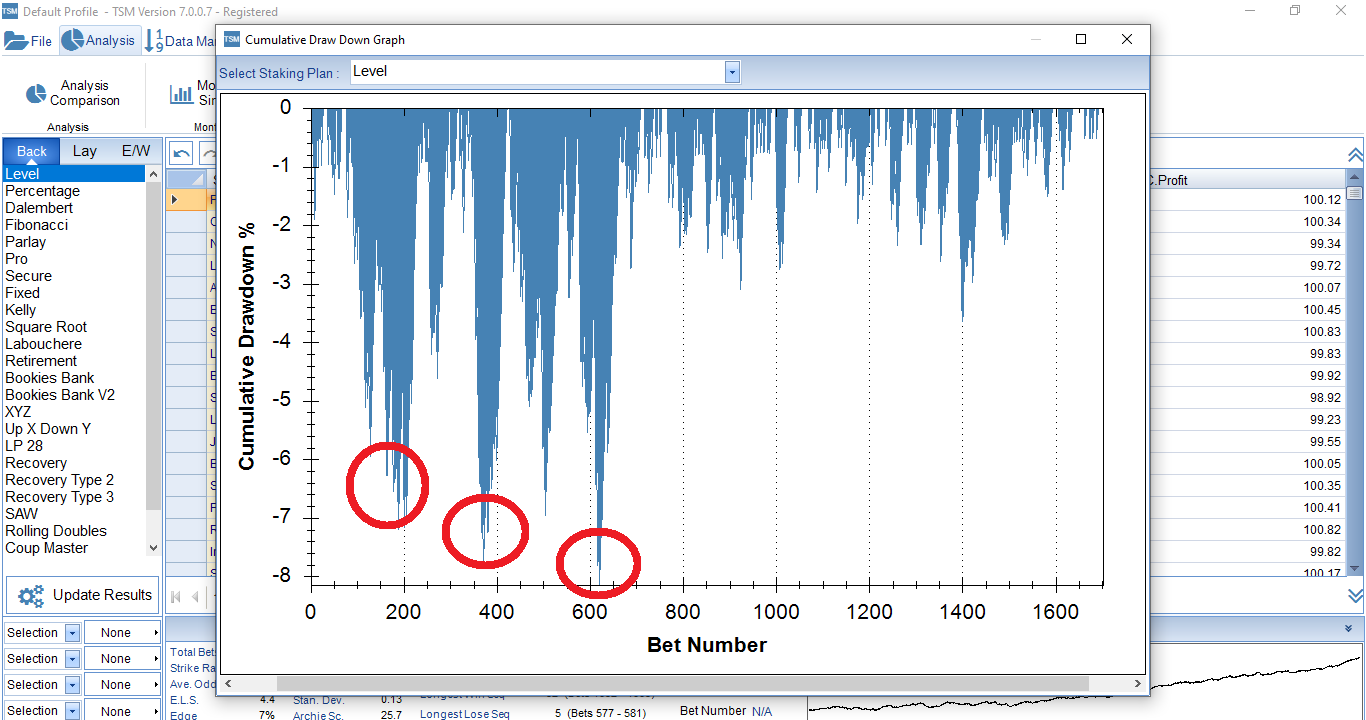
We can go further into this by looking at the cumulative drawdown tab. We can see where losing runs came close together and brought the bank lower. The worst case being -7 points drawdown reached on 4 occasions. This is again useful in planning our bank and being prepared for losing runs.
Another tab I find very interesting is the Odds Frequency chart where we can see how often the odds come up in each odds range. We can see this strategy is very heavily under 1.50 odds but does have over 100 bets between 1.50 and 20 and one bet that was over 2.00.
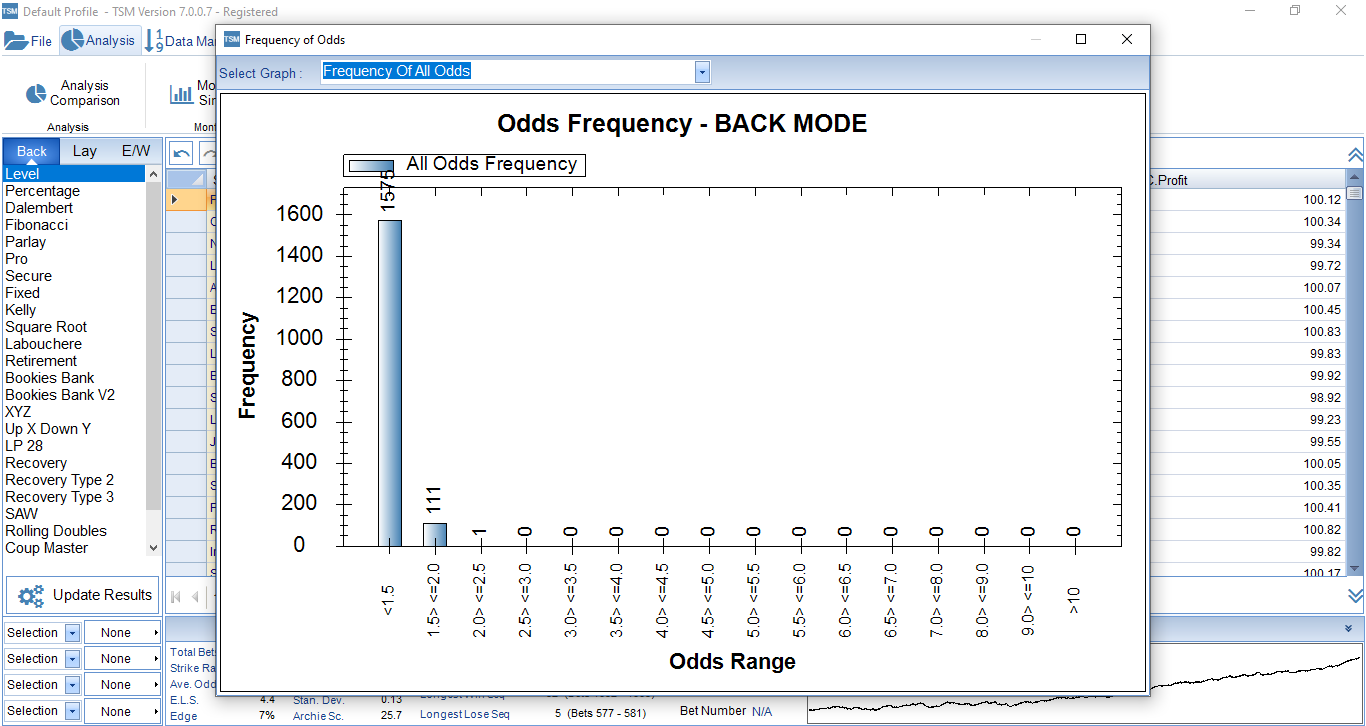
Even better, we can see the edge or yield for each odds range. And we can specify the odds ranges we want to see by editing the top right box.
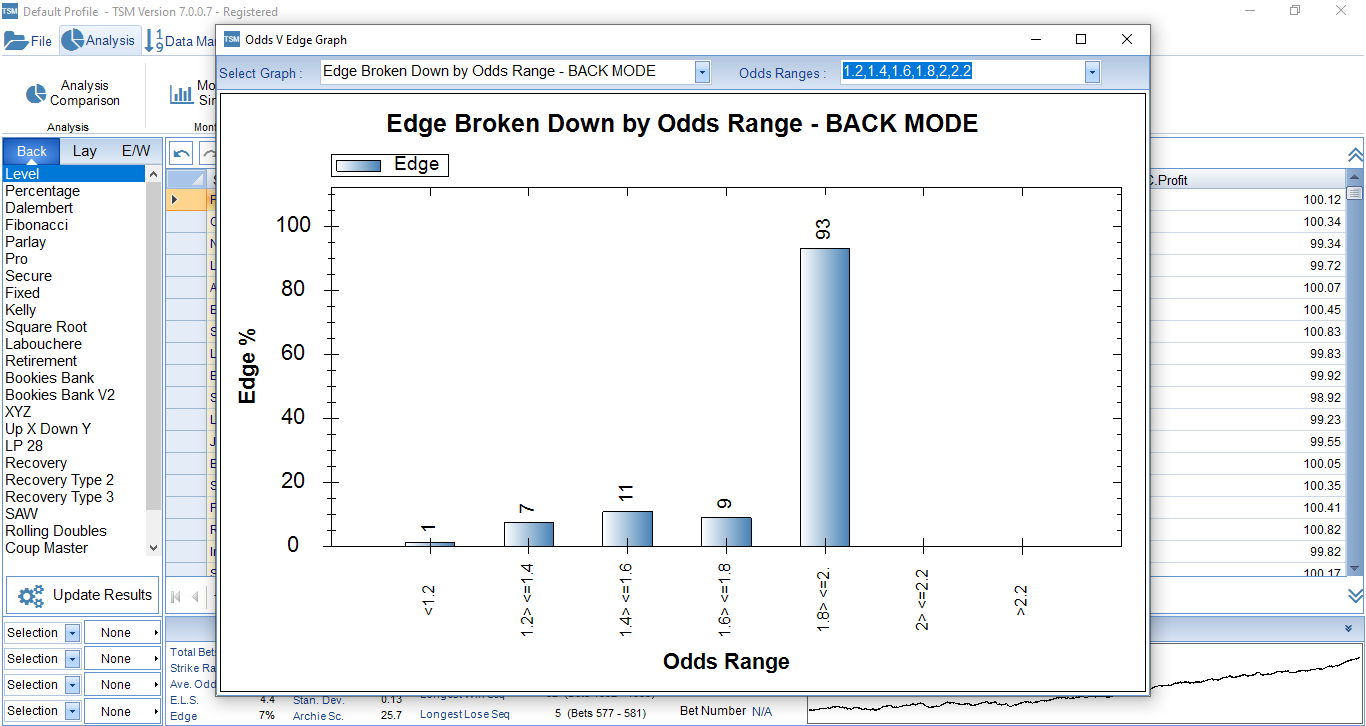
Now I can see that bets under 1.2 odds only had a yield of 1%, so I might consider not betting on those. I see that the higher odds bets have the best yield. The 1.4 to 1.6 range has a good yield of 11% so I might consider focusing on that odds range. The yield of 93% for the range 1.80 to 2.00 makes me think there were just a few bets that won and got a good yield as a result since it is such a high number.

![]()
Staking Plan Analysis and Comparison
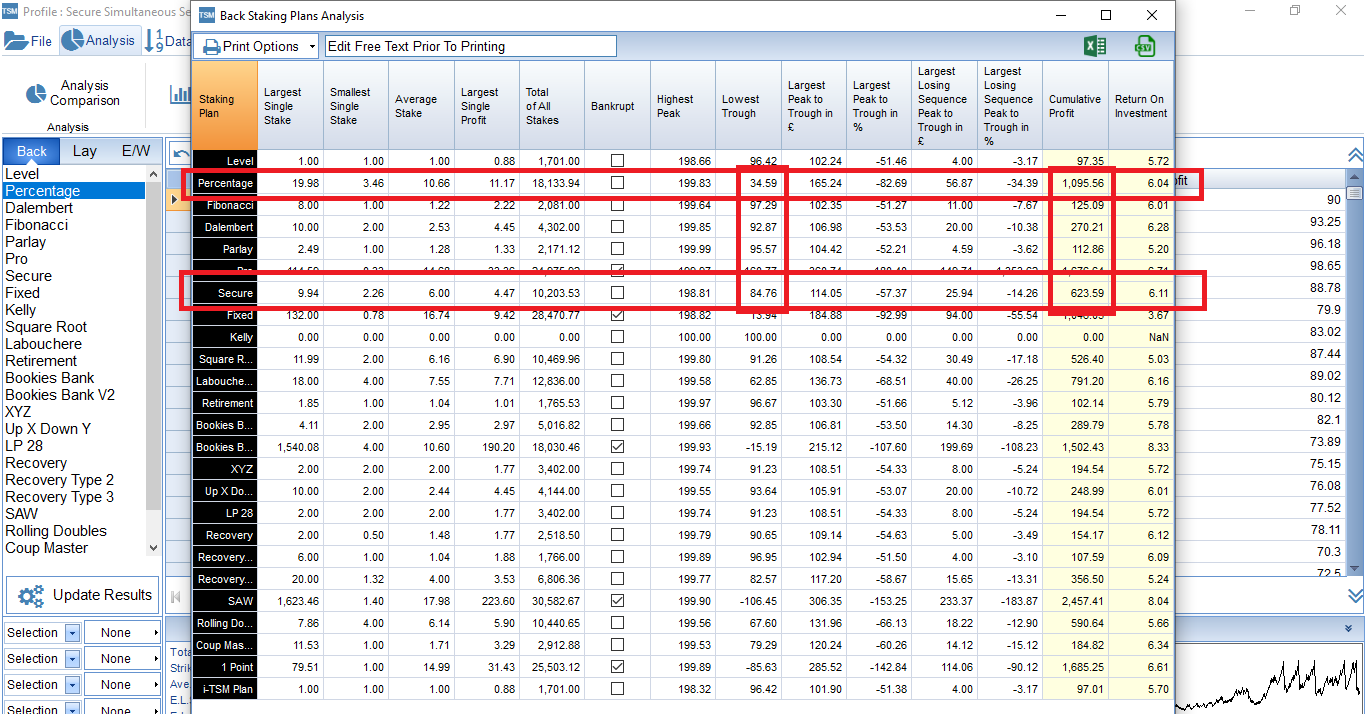
Next, and probably the most important feature of TSM is the ability to see which staking plan is the best for your betting strategy. Click on “Analysis Comparison” and instantly we can see what happens when we apply 25 different staking plans to this data.
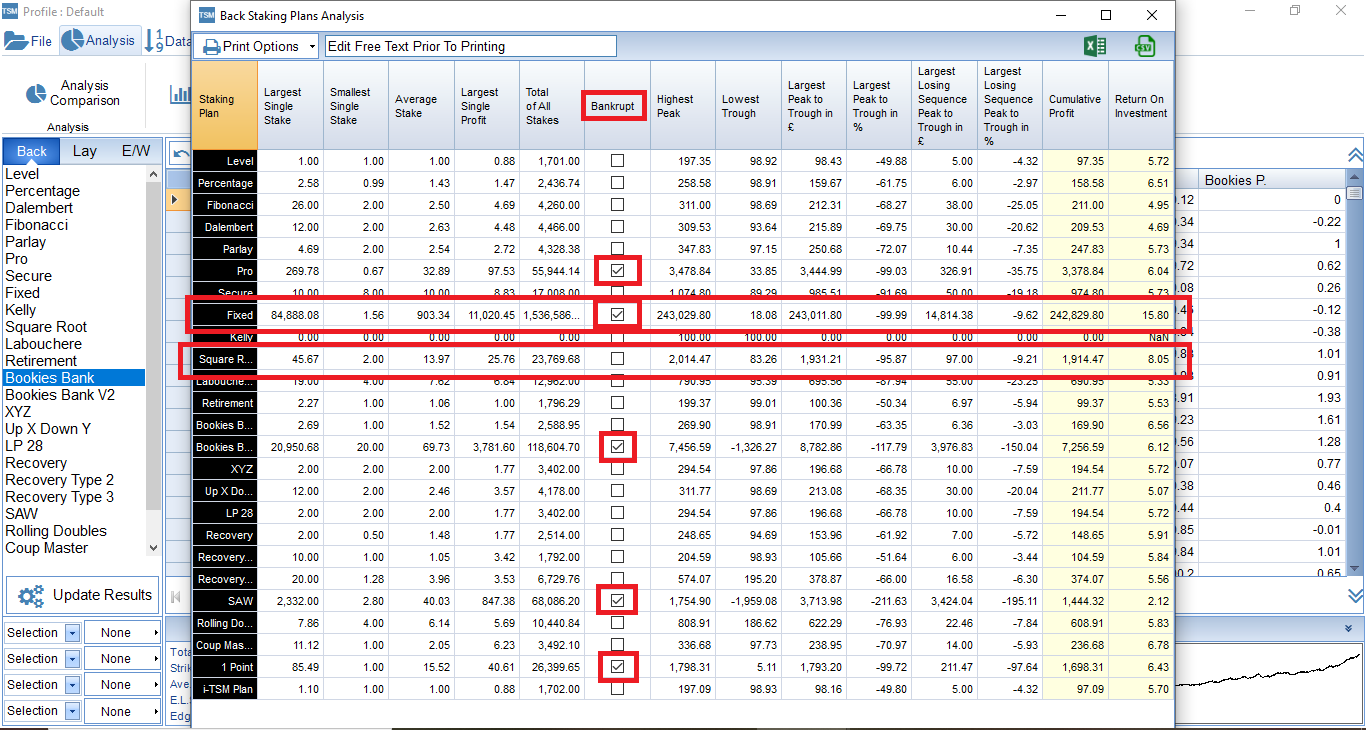
We see straight away that Fixed Staking (Target Profit Staking) gets the best results with 242,829 points profit (Cumulative Profit), but the betting bank does go bankrupt along the way. So we should not use this staking plan with those settings. The best staking plan listed here with no bankruptcy is the Square Root plan with 1,914 points profit which beat level stakes profit of 97 points by a lot. The Square Root plan is a form of staking where we bet more when we are in profit and return to original stakes when in loss. We can read more about it on the Staking Machine help file or website. Or you can see an in-depth analysis, demonstration and the best settings for this staking plan in The Staking Plans Book by Tom Whitaker.
We can get a lot information from this screen, for example we can see that using the Square Root Staking plan the biggest stake used would have been 45 units and the smallest stake was 2 units. We can see the average stake was 13.97 and the largest single profit from one bet was 25 points.
Other important figures are the highest and lowest peaks of 2,014 and 83 points. The lowest peak in particular tells us how far down into our initial betting bank we went. If we start with 100 points, then a 83 point low means a -17 loss was the worst we went into our starting bank.
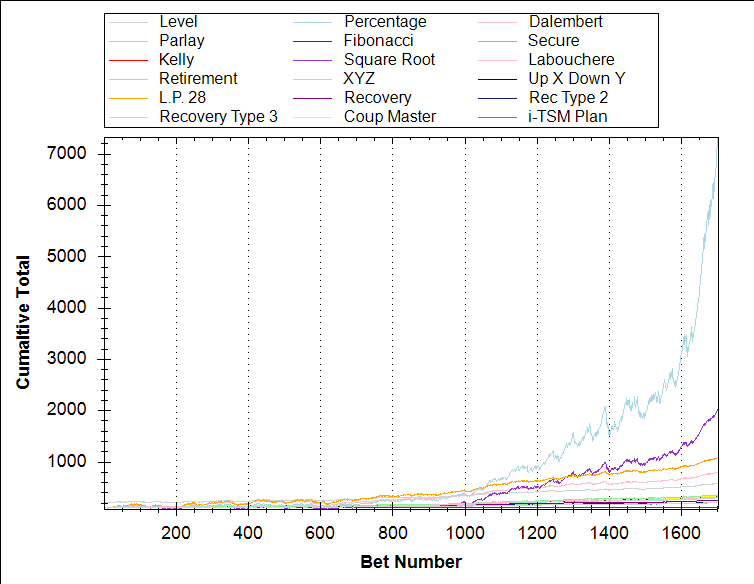
Another fantastic feature of TSM is that we can see all the staking plans on one graph by clicking on the “Cumulative Total” bar.
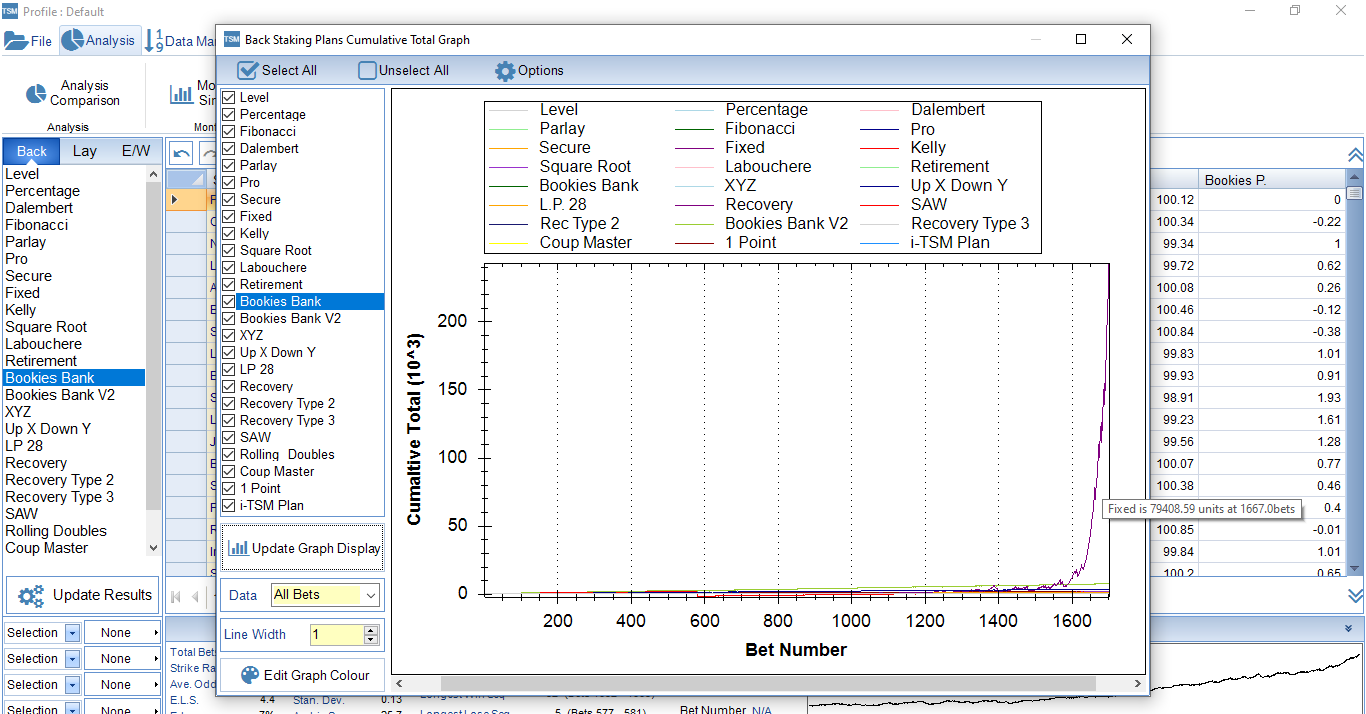
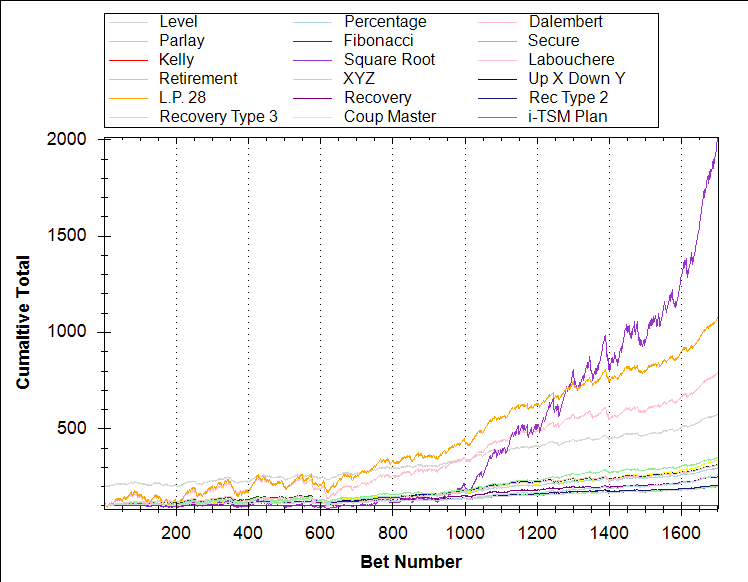
When we first click we might see a strange graph as the most successful yet bankrupt staking plan pushes the others out, so we can deselect the bankrupt plans.
Then we can see much clearer which staking plans gave the smoothest profit ride. Hovering the mouse over each line will tell us which one it is. From this we can see that Secure Staking (the orange line) seems to have the smoothest profit progression. So we would be interested in checking this staking plan out further.
One important thing to note here is that each staking plan is on its default settings right now. That means there may be better settings that can be used to get even more profit out of the strategy. In The Staking Plans Book, we found that Percentage Staking was actually the best staking plan for the Colossus 3 strategy.
We can go to the “Staking Plan Settings” tab and click on “Edit Staking Plan Settings”. Then we can select “Percentage” from the list of staking plans and adjust the percent we will bet each time. If we bet 5% per bet, what would happen?
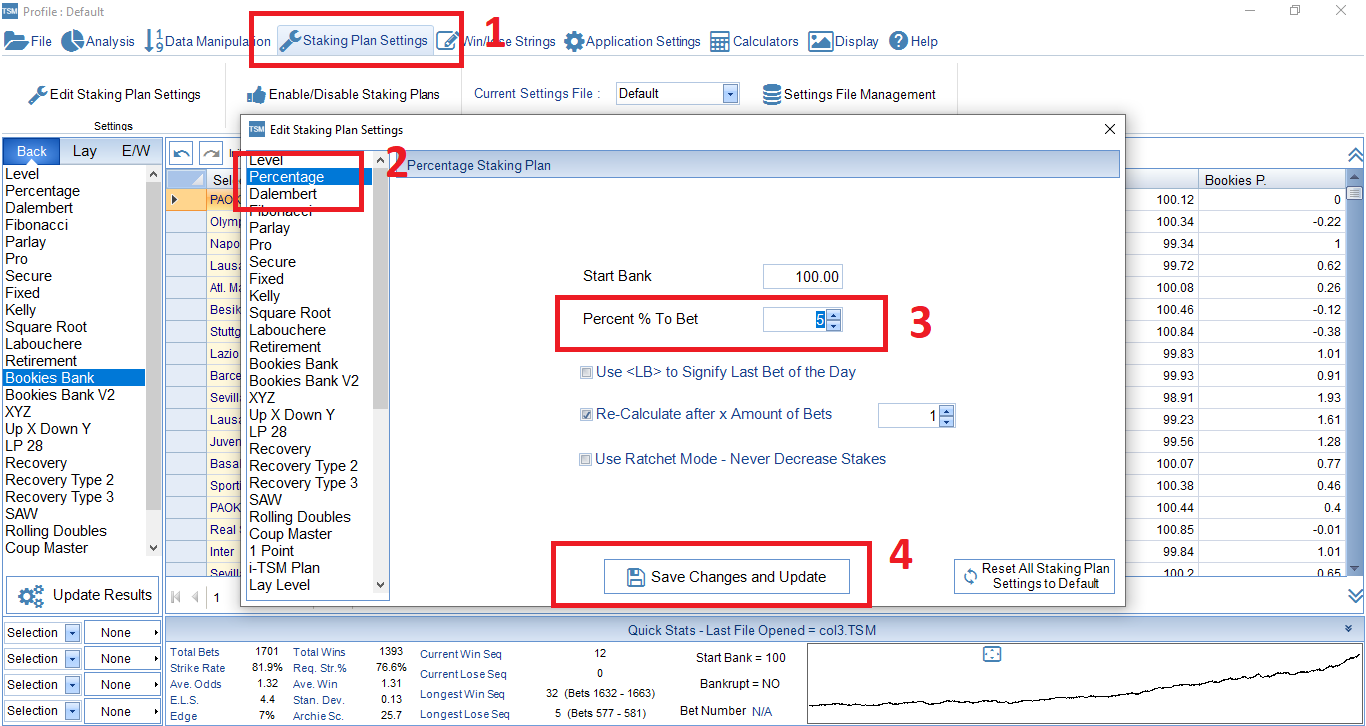
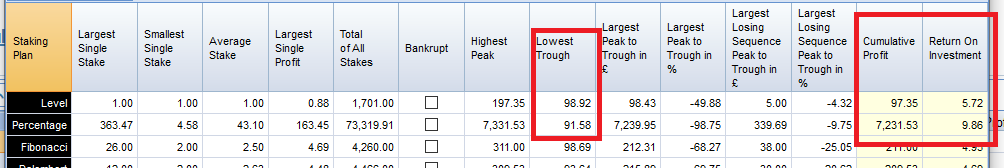
We can see that percentage staking now beats all the other staking plans and gets a result of over 7,000 points. The Analysis Comparison shows us that yield is now up to 9%, so we have improved on level stakes. Also, the lowest trough was just 91 points, that’s just -9 points from the starting 100 point bank. It is this kind of analysis that can show us very quickly why using one staking plan will be better than others.
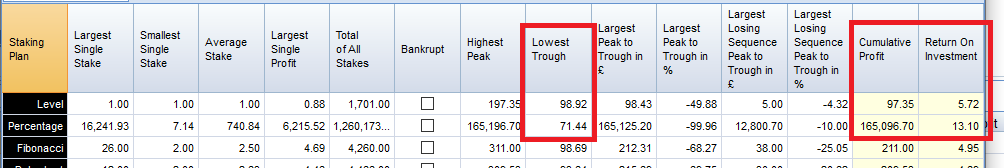
Let’s try changing the setting to 10% and see what happens. Wow. We get a profit of 165,096 points and the lowest trough was just 71. That looks good. But is it safe to bet 10% each time? We can check this by doing a Monte Carlo Simulation. This is where the data is shuffled so that the order of matches is randomized. This means we can check if the fixture list had been different, would we still have been ok and not gone bankrupt. It is a good guide for how safe the staking settings are.
Click on the “Analysis tab” and the “Monte Carlo Simulations” button. You can select how many times that you want to shuffle the data up to a maximum of 100,000 times. The more simulations you do, the longer it will take your computer to calculate it. Here we try 1,000 simulations.
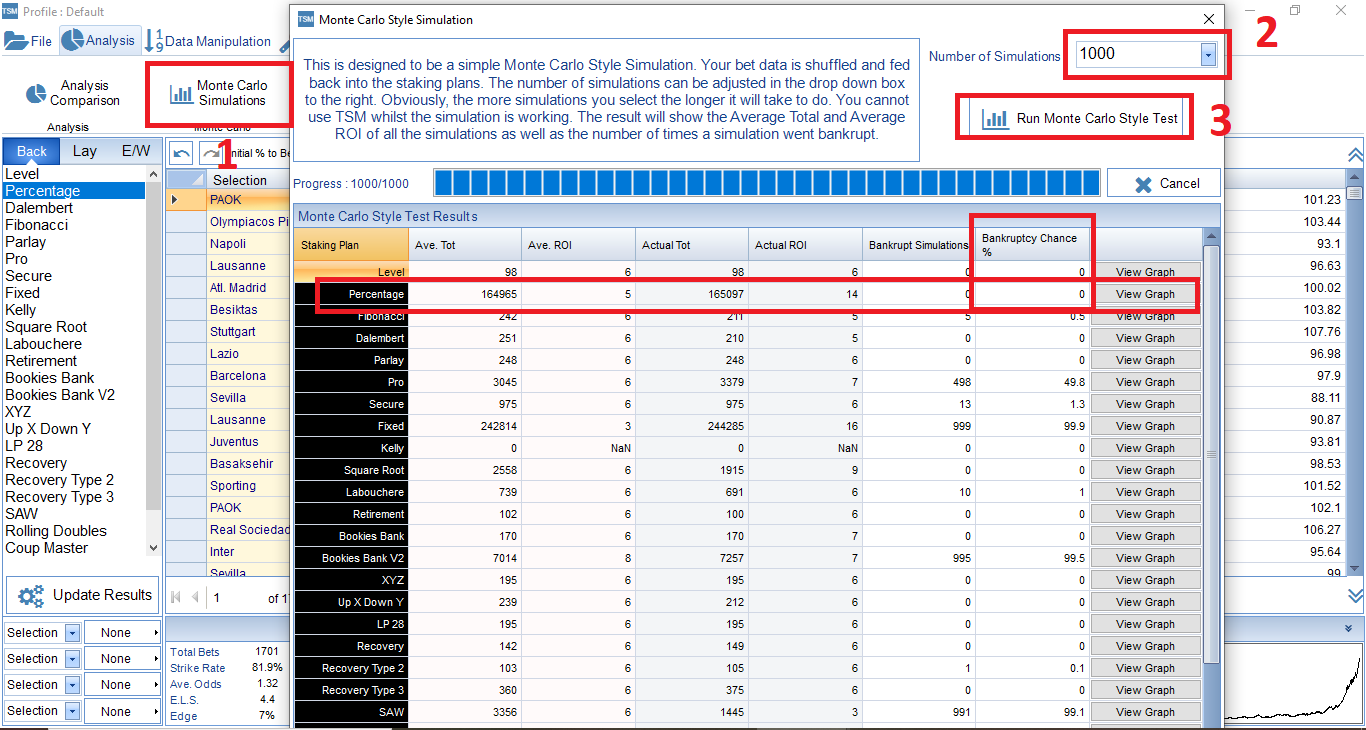
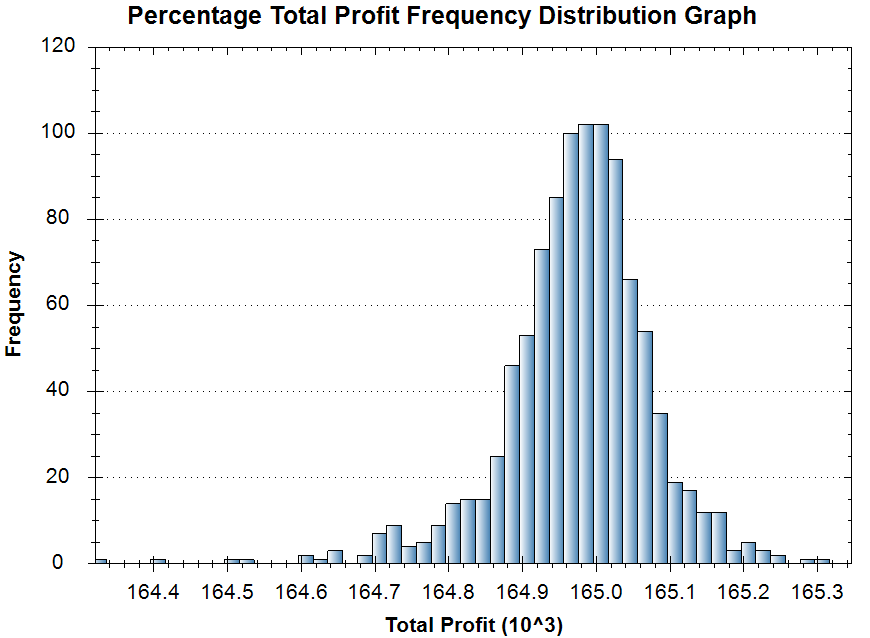
Here we get a very important graph that gives us valuable information for selecting the correct stake size. Good news. The Percentage Staking plan did not go bankrupt in any of the simulations. And the average profit was 164,965 points profit. We can see a graph of this.
This graph shows the number of times each profit level was reached. We can see that in most cases we will get between 164,000 and 165,000 points profit. (10^3 = the bar chart units + 3 zeros, so 164.8 = 164,800) This means that if we follow this staking plan we are likely to get similar results in most situations if the betting strategy trend continues.
Even more importantly, we see that the Secure Staking plan that was previously our smoothest staking plan actually went bankrupt on 13 out of 1,000 simulations. That means that if the fixture list had been different, 13 times we would have gone bankrupt. That means that the secure staking plan with its current settings is not good for this strategy.
You can find the best staking plan for your Betaminic big data betting strategy by slowly increasing the stake size in the staking plan settings, checking it does not go bankrupt, checking the lowest trough is not too low and then checking Monte Carlo simulations to make sure it does not go bankrupt. By repeating this process you can find the best staking plan for your strategies.
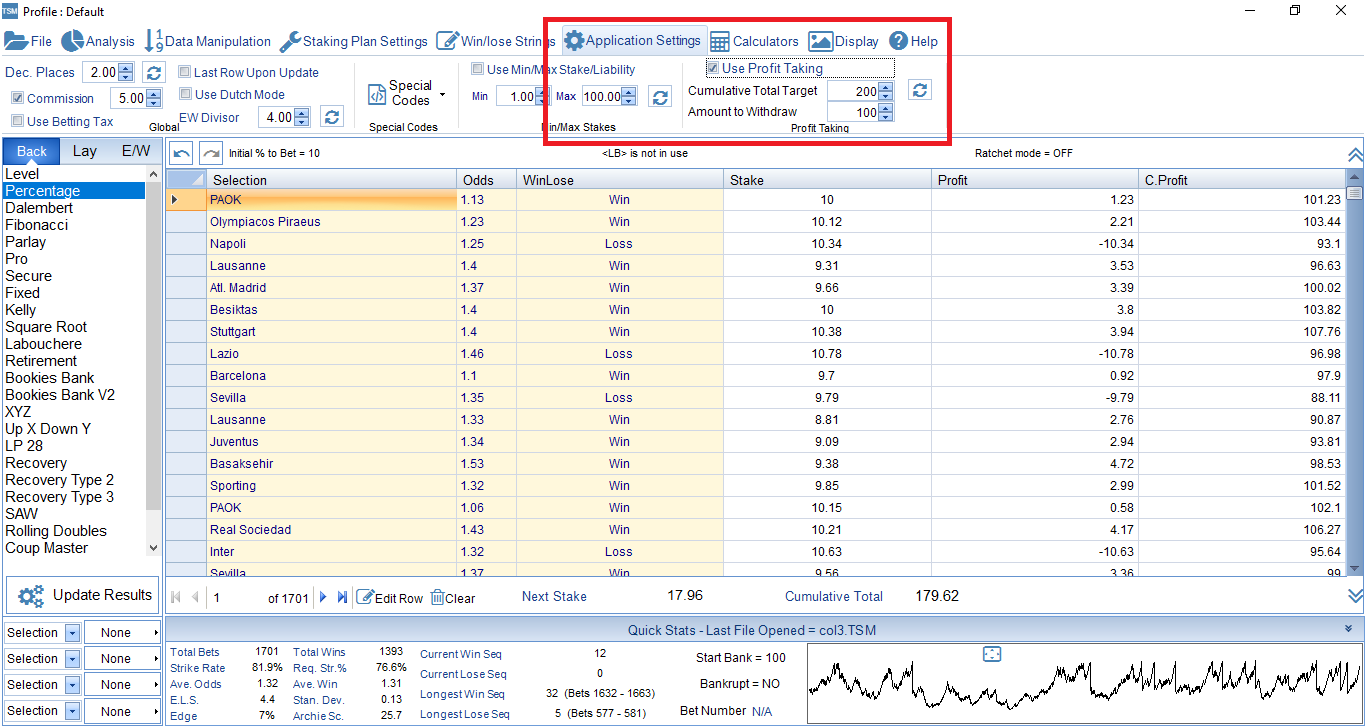
Profit Taking
One more important concept to think about is profit taking. When do you take out from the bank. Also, these results are based on letting the bank ride for the 7 years that this strategy has been going. In reality, we need decision points where we choose to take out some of the profit or to let it ride. In The Staking Plans Book, the suggestion is to set profit taking at the doubling point. When the starting bank doubles, then take out the profit and reset the bank to 100 points again. For research purposes this means we are constantly resetting the bank to 100 and seeing how the strategy performs from different starting points. If we don’t reset the bank, then in the research, the bad runs later on will just be covered by the profits from the first year. So it gives us a better way to see how the strategy copes in the bad runs. In reality, when the bank doubles, you can choose to let it ride or take some out. It is a good moment to make a judgement about profit taking.
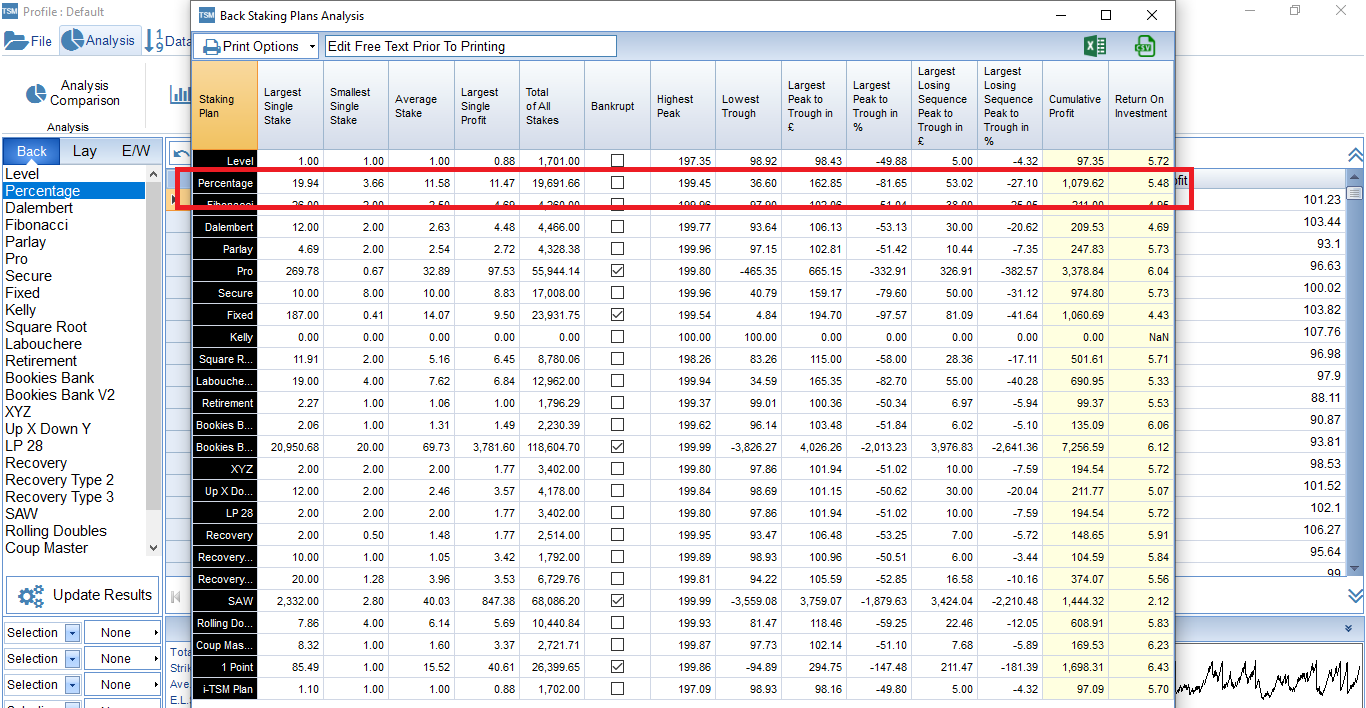
On the “Application Settings” tab, tick the “Use Profit Taking” box and set the “Cumulative Profit Target” to 200 and the “Amount to Withdraw” to 100. Then “Update the Results”. Now when we click on “Analysis Comparison” we see the Cumulative Profit for the Percentage Staking plan is 1,079 points. Each time it reached 200 points, it withdrew 100 points and started the bank again. This means it doubled its bank 10 times! 79 is the current profit and before that it withdrew 100 points ten times. If you had not withdrawn the points and let it ride, it would be 164,966 points. (You can untick the “Use Profit Taking” box to see the total profit if it was left to run with no withdrawals.)
The mini-graph then has much more meaning for us now. Each peak is where the bank reached 200 and had a withdrawal. The gaps between the peaks are how long it takes to double the bank. We can see that sometimes there is a long gap where we had a bad run but we still finally got back to doubling the bank. And there are some short gaps between peaks where we had a good run and doubled the bank quickly. This gives us an excellent visual guide of how much mental discipline we will need to follow this strategy with this staking plan. Look carefully at the long gaps and imagine if you will be able to wait and persevere through those bad runs so that you can enjoy the good runs.
We can also click on the “Data Manipulation” tab and select “Shuffle Sequence” to shuffle the order of bets, like a single Monte Carlo Simulation. We can see how the winning and losing runs might affect the strategy if the fixture list and order of wins and losses are different in the future. We can see again long gaps and short gaps between doubling the bank. This is a great visual guide for the nature of the strategy and also a key part of big data strategies is that you need a long term plan to take advantage of them and then to stick to the plan without changing things when a bad run comes. The right staking plan applied to the right strategy can multiple and leverage profits immensely.
You can try different staking plan settings to see if you can get better profits without going bankrupt and without having a lower trough.
5 Steps to Analyze a Betaminic Strategy
- Import strategy data
- Change the staking plan settings
- Check the profits, bankruptcy and the lowest trough
- Run Monte Carlo Simulations
- Repeat steps 2, 3 and 4 until you find the best staking plan settings for your strategy
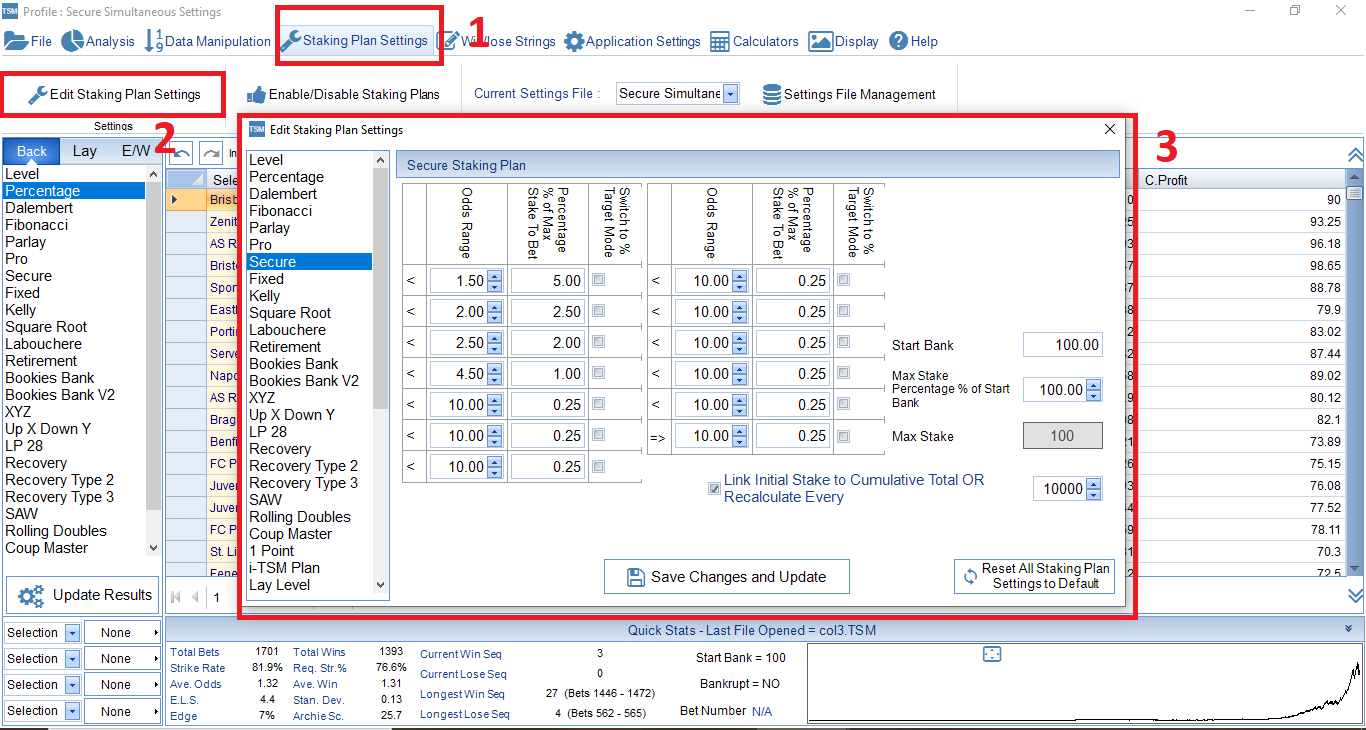
There are a wide variety of settings, and you can find the best general settings for each staking plan in The Staking Plans book where it has already gone through this process for you. It can give you a good starting point for settings to apply to other betting strategies. A highly recommended general staking plan that is good for most betting strategies is the Secure Staking plan. (Betting different amounts depending on the odds bracket.) The best settings for the Secure Staking plan, which we shared in the previous article on staking here, are these.
| wdt_ID | Real Strategies Betaminic | Av. Odds | Basic Staking Profit | Secure Staking Profit | Change |
|---|---|---|---|---|---|
| 1 | Colossus 3 Free Scoring Favourites | 1.32 | 110 | 1,861 | 1,692.00 |
| 2 | Pro-home Luisbang | 1.36 | 132 | 1,803 | 1,366.00 |
| 3 | Betting on favorite with low odds | 1.48 | 156 | 1,144 | 733.00 |
| 4 | Pro1 Away Day Blues | 1.84 | 144 | 425 | 295.00 |
| 5 | Colossus 5 Against the Trend Overs | 1.99 | 191 | 865 | 453.00 |
| 6 | Over 2.5 Total Share | 2.06 | 246 | 1,071 | 435.00 |
| 7 | Betaminic Over 2.5 Against the Trend | 2.28 | 142 | 730 | 514.00 |
| 8 | Betaminic Mix6 (6 Systems Mixed) | 2.79 | 803 | 5,475 | 682.00 |
| 9 | Colossus 6 Scoring Away Overs | 3.04 | 268 | 1,446 | 540.00 |
| 10 | Pro7 Bore Draw V2 | 3.21 | 399 | 953 | 239.00 |
| 11 | Colossus 19 No Favorite Unders Draw | 3.22 | 482 | 865 | 179.00 |
| 12 | Colossus 17 Dog Draw | 3.24 | 598 | 1,257 | 210.00 |
| 13 | Bonus Strategy 6 Aways | 3.29 | 163 | 274 | 168.00 |
| 14 | Bonus Strategy 5 Draws | 3.53 | 382 | 841 | 220.00 |
| 15 | Colossus 10 Away Dog Draw | 3.83 | 209 | 452 | 216.00 |
| 16 | Pro5 Undefeated Home Dog | 4.11 | 340 | 515 | 151.00 |
| 17 | Pro8 Underestimate Underdog V2 | 5.20 | 136 | 305 | 224.00 |
On TSM, the Secure Staking Settings page it looks like this
When we look at the Analysis Comparison data again, we see that Secure Staking makes less profit than the Percentage Staking but its lowest trough is only 84 compared to Percentage Staking’s 34. That means the Secure Staking settings are much less aggressive than the Percentage settings in this case and we won’t have to go through the pain of seeing our bank possibly reduced to 34% of its starting level.
Further Data Analysis and Manipulation Tools
Opening Odds Vs. Closing Odds
We can manipulate the data in other ways, too. For example, if when importing data, we use the opening odds instead of the closing odds, we can easily see which is better, to bet early on the opening odds, or to bet late on the closing odds. You will find that overall, it does not affect the final outcome of profit, since some odds go up and some odds go down, as explained in one of our articles . The importance is to identify the value selections.
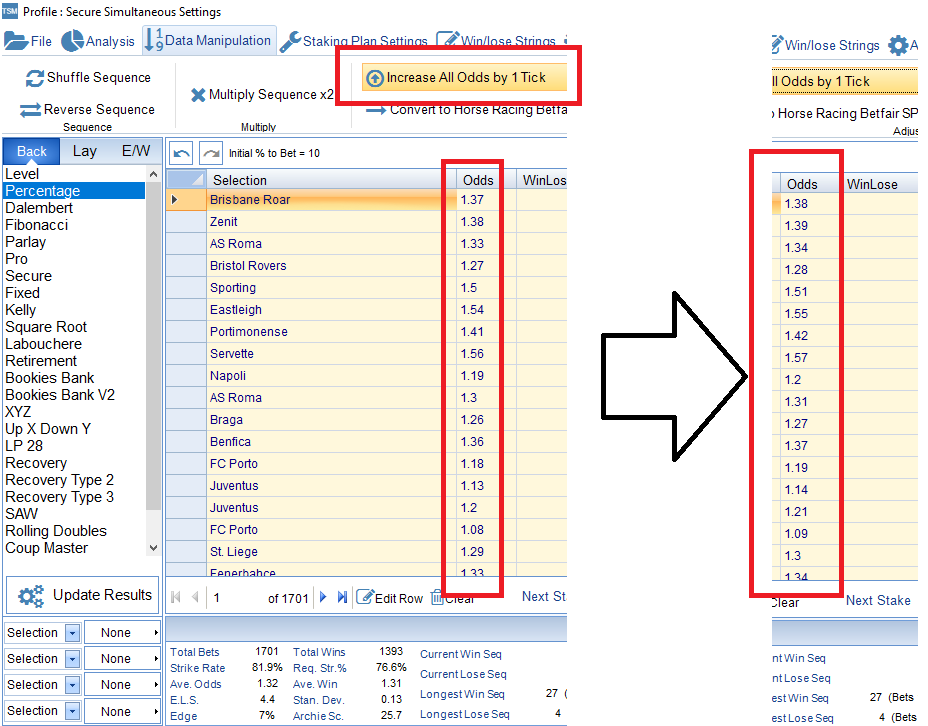
Getting the Best Odds
Also, we can find the importance of getting the best odds. If you shopped around and managed to get just 1 tick higher on each bet (e.g. 1.18 odds instead of 1.17) then it can drastically improve results. On the “Data Manipulation” tab, click on “Increase all Odds by 1 Tick” and we see the Secure Staking results change from 7,695 total points profit to 14,105 points! Nearly double the profit just by getting slightly better odds. This really shows the importance of trying to get the best odds every team, even by just 1 decimal point higher. (On level stakes 110 points profit is only improved to 123 points, which shows how better odds impact profit more if the right staking plan is being used.) Using odds comparison sites or always requesting one tick higher on Betfair is highly recommended.
Advanced Data Analysis for Betaminic Big Data Strategies to Find the Best Staking Plans and Create a Complete Betting System.
In conclusion, if we analyze our strategies and find the best staking plans for them, we can multiply our level stakes profits. But with more research on individual strategies, it is be possible to squeeze even more profit out of strategies. The Staking Machine can help us do that.
![]()
Sign Up for free to access the Betamin Builder here.
Read more about The Staking Plans Book
Access Betlamp, the amazing free statistics tool here.
See more Betaminic Books here including a free eBook.
See the best betting systems ranked by profit, ROI and risk here.
Read more about the free Betaminic Public Strategies here.
Read more about opening and closing odds
Read more Betaminic posts here.