6 simple Steps to Avoid Data Mining in Big Data Betting Systems

Avoiding data mining is an important issue when using big data in betting strategies. But what can we do about it? This article will show you all the steps to follow to create profitable strategies without over-optimizing systems and results.
Tom Whitaker, the author of books such as “Winning Sports Betting Strategies with Betaminic” and “Big Data Betting on Football – The Betaminic Guide 2”, has made a follow-up video (Video link: https://youtu.be/mH0w6IA479g) to show his idea of how to avoid data mining when creating profitable strategies. He also introduces his new research concept of “Big Data High Yield” league selection (BDHY). The video shows how to use some more advanced techniques with the Betamin Builder big data analysis tool. It demonstrates splitting the data into two periods, a Research Period and a Test Period. It also suggests tags for descriptions of shared strategies to help explain how a strategy was made and how its leagues were filtered.

*** The video has audio in English, and also with subtitles available in English and Spanish.
The video suggests these steps when researching a strategy:
STEP 1: Split Data
STEP 2: Match Filters
STEP 3: League Filters
STEP 4: Check by Season
STEP 5: Test Strategy
STEP 6: Follow Strategy
Let’s look closer at these steps.
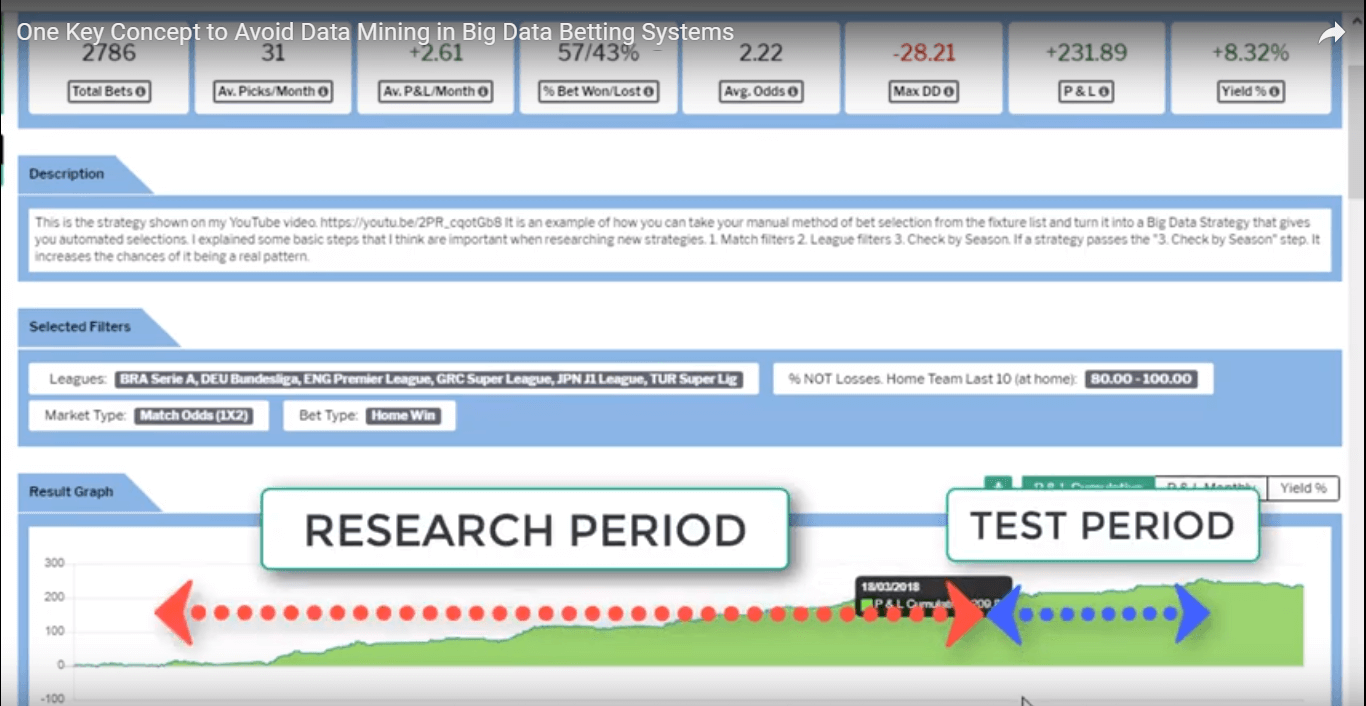
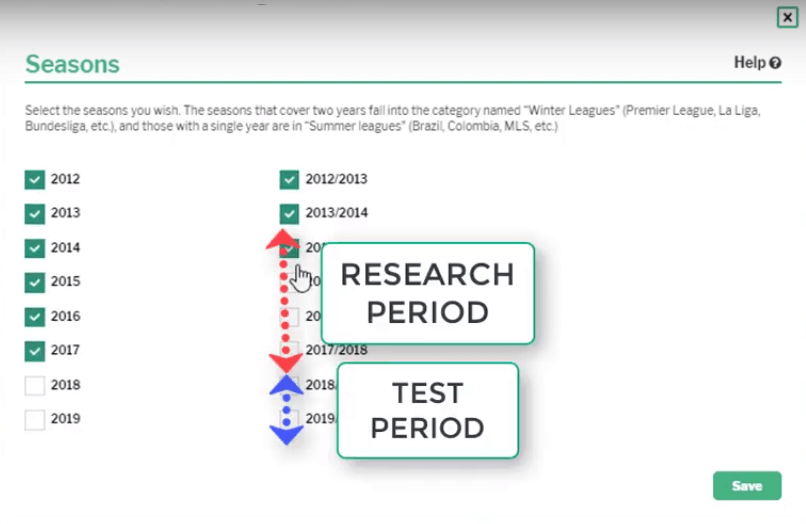
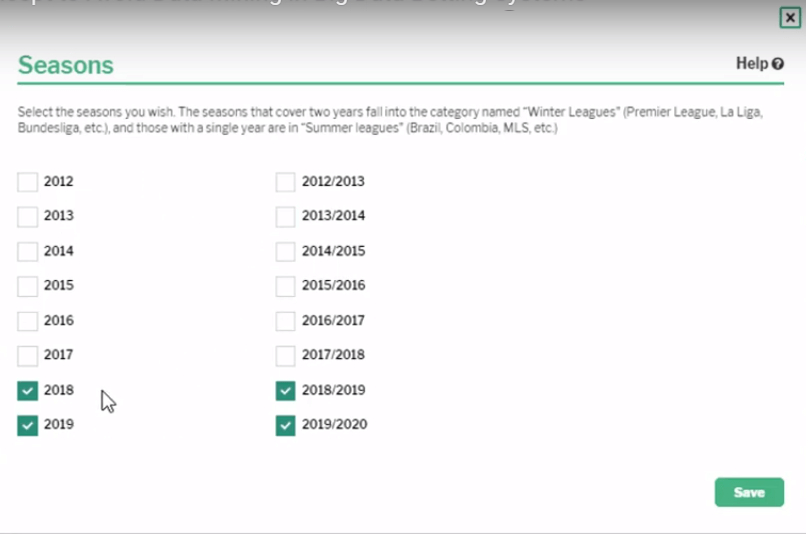
STEP 1: Split Data
This is a step where we split our data into two periods, a Research Period and a Test Period. Only the Research Period data is used to create the new strategy. Once the new strategy has been created and the match filters and league filters have been finalised, then, and only then, is the strategy applied to the Test Period data. This is the key concept to add when thinking about how to avoid data mining. If we do not split the data and use all of the data to create a strategy, we do not know if it is a real pattern or just “cherry picking” the winning leagues and past matches. In that situation, we will not know if a strategy works until we actually start using it with new data. But if we split the data at the beginning, then we will already have some “new”, untouched, fresh data ready to be used to test the strategy created. This will not remove the chances of data mining completely, but it will go a long way to help avoid the simplest types of data mining when we just select the winning leagues and are then surprised that the pattern does not continue. With a Research Period (RP) and Test Period (TP), we can see immediately if the newly discovered pattern from the Research Period does continue in the Test Period. Then we can have high hopes for the pattern to continue. Tom splits his data into 6 seasons of Research Period and 2 seasons of Test Period. But in theory, you could also try 5 seasons of Research Period and 3 seasons of Test Period data. It is up to you. But it is important to have at least one full season of Test Period data to apply a newly researched strategy to.
Having split the data in step 1, then we move on.
STEP 2: Match Filters
Good ways to apply match filters are to think about what manual selection methods you used when you picked your own bets in the past by looking through fixture lists. Did you look for teams that had won x-number of times in the last 6 games? Did you look for teams that were good at home, but bad away? Did you look for big name teams away to mid-table teams with a good home record and back that home team to avoid defeat? You can take your selection method and see if you can automate it in the Betamin Builder tool. Get the tool to do the same analysis you did and see if your method applied to 54 leagues in 100,000 past fixtures over the past 8 years would have made a profit. Another way to select match filters is to look at each filter and imagine what you would expect to happen if a certain filter was selected, for example, the filter that selects teams that have conceded x-number of goals in previous games. I might look at the filter and imagine that I would like to back over 2.5 goals in home games that team is playing when they are favourite because they probably have to win 2-1 or better because of their leaky defence. So I could apply that filter and see if my idea leads to profit. So you can apply filters according to your manual selection style, or by looking at each filter and imagining what outcome you would expect from applying it.
STEP 3: League Filters
This is where a new idea of Big Data High Yield (BDHY) league selection is suggested in the video. When selecting leagues, if we just choose profitable leagues, or leagues that have over 10% yields in them, there is a danger that we are again “cherry picking” the winners. We are just picking the leagues that look good. Of course, a 47% yield looks good, but how much data is that number based on? If there were only 4 bets that led to that 47% yield for that league, can we really say that is a genuine pattern? It is just 4 bets that won. There is not enough data to say anything about that league. The point of Big Data Betting is to look for patterns in the data to find out where the bookmaker models are consistently wrong in certain conditions. And we can only see those patterns if we have enough data. So Tom suggests that only leagues with 100 bets or more in them can be considered to have enough data for including in a strategy. After 100 bets, if there is a positive yield, we can admit that there is a pattern. If it is a lucky run, then it is a very long lucky run that is in profit after 100 bets that followed a fixed filter to select them. And even then, a small yield of 3 or 4% after 100 bets is not enough to highlight a pattern. So it is better to have target yield limits for different bet number amounts in league selection. The suggestion in the video is:
Include leagues with 100 bets or more in their Research Period with a 10% or higher yield.
Include leagues with 200 bets or more in their Research Period with a 5% or higher yield.
Include leagues with 400 bets or more in their Research Period with a 4% or higher yield.
The reason why the yields can be lower for higher bet numbers is that if you have 4% profit after 400 bets, it is a good sign of a strong pattern, but 4% profit after 100 bets has a higher chance of just being a lucky run. Thus the yields can be lower for larger data sets. Conversely, if there is not enough data for 100 bets in any of the leagues it might mean it is best to avoid that strategy until it has more data, or to increase the yield required for a league to be included, for example including leagues with over 75 bets with a yield of 20% or higher, and so on.
Tags for Strategy Descriptions for Shared Strategies
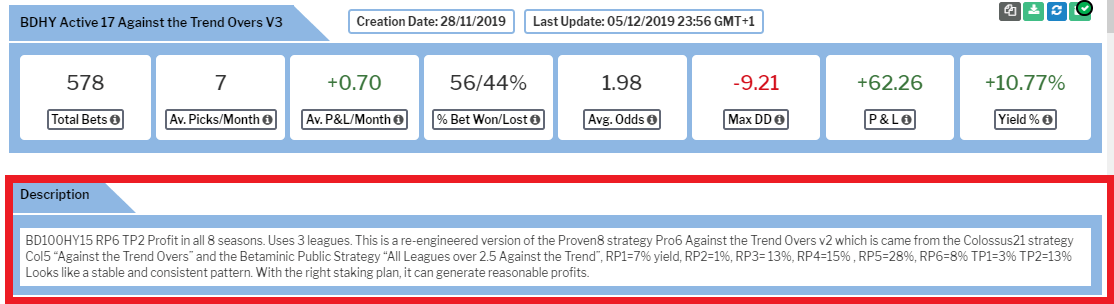
Another idea in the video is to add more information in the description box of shared strategies so that other users can know how a strategy was researched. One suggestion is to add simple tags such as “BD100HY10 BD200HY5 RP6TP2” in the description box so that others can understand that: Leagues with over 100 bets and yields above 10% (BD100HY10) were included, leagues with over 200 bets and yields above 5% (BD200HY5) were included, and the strategy was created with a 6 season Research Period and a 2 season Research Period (RP6TP2). In this way, very quickly and easily, regardless of a user’s native language, they would be able to understand and make a judgement about whether they want to follow a strategy or not. If we add more explanations to our strategies, then the shared strategies area can become more of a “university of betting” to help us all get closer to the perfect betting system and get the most out of this fantastic tool. Adding tags can also help yourself in your private strategies, too, because when you come back to look at why some of your strategies are doing well and some doing badly, then a pattern might emerge in the way the strategies were created. Having explanatory tags can help you remember and understand what kind of strategy you created.
STEP 4: Check by Season
This is a step to find out if a strategy is consistent or not. Even if a strategy makes lots of profit, if that profit all came in 2 good years and the other 4 years were losses, then there are very few bettors who would have continued using a strategy with such a long negative streak. So by checking each season’s results individually we can see if the pattern is consistent or not. If a strategy is giving results of 1% yield in one season and 22% in another and -4% in another, we can say it is inconsistent, but if it keeps giving annual results of between 4-8% yields, we can say it is a very consistent pattern and be confident to follow it. Again, we can add tags to the description area to let others know the yields of each season. For example, RP1=7%, RP2=1%, RP3= 13%, RP4=15%, RP5=28%, RP6=8%, TP1=3%, TP2=13% tells us that this strategy had a yield of 7% in its first Research Period Season (RP1=7%), and the following five Research Period seasons had yields of 1%, 13%, 15%, 28%, 8% which is a good positive trend. Then we can also understand that the first Test Period had a yield of 3% (TP1=3%) and the second Test Period season has a yield of 13% (TP2=13%) We can also tell people a quick summary in the description field by adding comments such as “All 8 seasons in profit.” or “Strong Consistent Pattern” or “Weak Inconsistent Pattern”. So checking strategies by season is a good way to find consistent patterns.
STEP 5: Test Strategy
Then after we are happy with our newly researched strategy, after we have finished selecting match filters, league filters and have checked the seasons for consistency, then we can do the final check which is applying the strategy to new data, which is the Test Period. We can consider this to be like watching what would have happened if we had researched a system with all our data and followed it for real for 2 seasons. The Test Period is fresh, untouched, new data. So if it makes a profit, then it means the pattern holds true, but if it makes a loss, it means the pattern is likely a result of data mining and not a true pattern in the odds models. This is the key importance of splitting the data, so that we can test it without risking any real money or wasting precious time following false patterns.
STEP 6: Follow the Strategy
Once we have found a pattern that looks strong and consistent, then we can follow the strategy. We can do that by clicking on the email icon on the top right of a strategy and buying a pick pack so that we can get new selections emailed to us as they come up. After the hard research work is done, the next step is making sure to get the bets on at the best odds available at the time you place your bets. Having access to multiple bookmaker’s odds is always beneficial but asian bookies and Betfair often have the best odds in the market, so those are two important betting sites to have access to if you are able. If you do think a strategy is good enough to follow, please share it on the shared strategies page.
So in summary, by splitting the data into two periods, by using a Big Data High Yield league filtering method, by checking each season’s results and by adding explanatory tags in the shared strategy descriptions, we can improve our chances of getting even better big data strategies.
STEP 1: Split Data
Concept: Research Period and Test Period to avoid data mining.
Tags: RP6TP2
STEP 2: Match Filters
STEP 3: League Filters
Concept: Select leagues with large data sets to support their pattern.
Tags: BD100HY10 BD200HY5 RP6TP2
STEP 4: Check by Season
Concept: Look for consistent patterns and profits
Tags: RP1=7%, RP2=1%, RP3= 13%, RP4=15%, RP5=28%, RP6=8%
STEP 5: Test Strategy
Concept: Apply to new data to see if the pattern continues.
Tags: TP1=3%, TP2=13%
Comments: “All 8 seasons in profit. Strong Consistent Pattern.”
STEP 6: Follow Strategy
You can watch the video yourself here. Video link: https://youtu.be/mH0w6IA479g
The video has audio in English, and also with subtitles available in English and Spanish.
Subscribe to his YouTube channel Big Data Sports Betting and not miss any of his videos to help you improve your results in sports betting.
Sign Up for free to access the Betamin Builder here.
See the Staking Plans that you should NEVER use
Access Betlamp, the amazing free statistics tool here.
See more Betaminic Books here including a free eBook.