How to Calculate a Stop-Loss for your Betting System

How do you know when to stop following a strategy? This is a key question when using value betting strategies and one that we should ask during the planning stage and know the answer to even before we start following a strategy. In this article we will summarise ways to calculate a stop-loss depending on your risk level.
Basically, there are 3 ways we can calculate a stop-loss with the data available in the Betamin Builder.
- As a multiple of the Maximum Drawdown. (MDD.)
- As a multiple of the Expected Losing Sequence. (ELS)
- As a combination of both.
What is the difference between a drawdown, the MDD, a losing sequence and the ELS?
A Losing Sequence = one losing run of LLLLL.
The Expected Losing Sequence (ELS) = the expected longest losing run of a strategy based on its win rate and number of bets.
A Drawdown = the total loss from peak to trough of a single losing run LLLWLLLLWLLL.
The Maximum Drawdown (MDD) = the biggest drawdown in a betting strategy’s entire history.
A Losing Sequence is just a losing run. It is when a strategy has several losses in a row. So LLL is a losing run of 3 losses in a row. It is quite possible for a strategy to have 2 or 3 losing runs close to each other.
A Drawdown is when we have a long losing run with a few wins included in the sequence. Each win ends a losing run, but the negative trend of the strategy from a peak (its previous high point) to a trough (its next low point) is considered a drawdown. So this series of results “LLLWLLLLWLLL” is 3 losing runs with 2 wins in the middle, and makes one drawdown period.
The Expected Losing Sequence (ELS) is the longest expected losing run based on the historical win rate and the number of bets we are wanting to estimate for. Why do we need to also include a number of bets? This is because the longer we bet, the more chance of a longer losing run to occur.
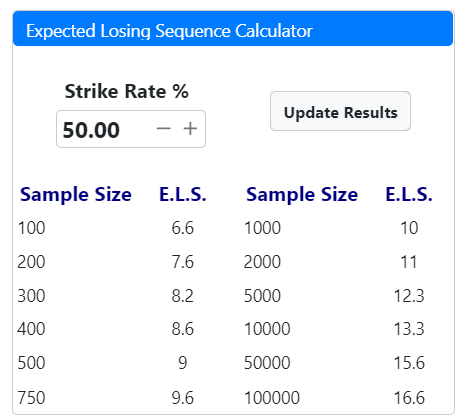
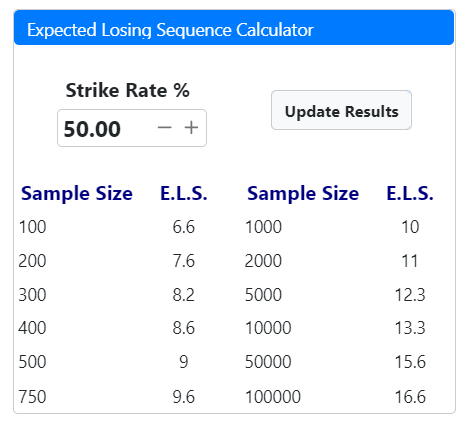
The ELS can be calculated with this online calculator on The Staking Machine website (Online Tools (Free) ->Expected Losing Sequence – E.L.S.)
It can also be calculated with a formula Log(n)/-log(1-SR)= E.L.S.
It can also be calculated using this formula in Excel: “=LN(n)/-LN((1-(wr/100)))” where n is the number of bets you want to calculate the ELS for and wr is the win rate. (A 50% win rate means you enter “50” where the wr is.)
For example, if we flip a coin, the strike rate will be 50%. (It will win 50% of the time.) If we bet on heads and flip the coin 500 times, then we can expect a losing run of 9 tails in a row. But if we flip the coin 2,000 times, we could expect a losing run of 11 tails in a row. The longer we bet, the more chance of a longer losing run. The lower the strike rate, the longer the losing runs will be. If we were thinking about how much of a 100 bank to bet on this, then 10 points per bet would only cover one ELS, and if there were 2 ELSs in a row, then we would be bankrupt. So it would be better to plan a bank that can survive 2,3,4, or more losing runs in near succession. Of course, the more ELS multiples we plan to survive, the smaller our stake will be and the smaller our possible profits for that betting bank size will be. This is where the multiple of the ELS and also the MDD become linked to conservative, moderate or aggressive staking risk levels in terms of a given betting bank size.
The Maximum Drawdown (MDD) is the largest of all the drawdowns a strategy has experienced in its history. So, if a Betamin Builder strategy shows an All Results MDD of -20, then it has never in its +11 year history since March 2022, had a drawdown that exceeded -20 points. This means that a 100-point betting bank that staked 4 points per bet would have gone to a historical low of -80 points from its starting level, but would then have recovered to its current level.
Another way to think of things is that the MDD is looking at historical data and telling us the worst thing that happened in the past, but the ELS is looking to the future and estimating future losing runs based on the historical data.
1. Using a Multiple of the Maximum Drawdown as a Stop-Loss
If we know the maximum drawdown, we can use that as a starting point and adjust the drawdown by a multiplier to match our risk level:
- A) MDD x1 – Strict Stop-Loss
- B) MDD x1.5 – Moderate Stop-Loss
- C) MDD x2 – Loose Stop-Loss
We call a MDD x1 a strict stop-loss because it is saying that we will stop following this strategy if history repeats itself and it experiences a loss that it has experienced before. This is in effect saying that, while the strategy at that point has not shown a trend that is historically worse than any negative trend that has come before, it has shown a losing trend as bad as previous losing trends. We feel this is a little strict, since stopping a strategy that is merely repeating the trend that encouraged us to follow it is a little strict.
We call a MDD x1.5 a moderate stop-loss because we are saying that we will stop following the strategy if it shows a negative trend that is worse than anything it has experienced in its +11 years history. We feel that this is an indicator that the trend the strategy is based on has stopped working due to market model changes or changes in the footballing nature of the leagues selected in the strategy. This seems like a fair and logical stop-loss, since the strategy is clearly breaking previous losing trends and it should make us re-evaluate the strategy as a whole. We may drop the strategy, or update it with the latest data and reconsider which leagues to filter in and which odds bands to use.
We call a MDD x2 a loose stop-loss because we are saying that we will stop following the strategy if it shows a negative trend that is two times worse than it has ever experienced before. This style is giving the strategy a very big benefit of the doubt after it has broken the MDD x1.5 mark to see if the strategy will return to its trendline. But once it has reached double the historical worst drawdown, then we stop following the strategy and reconsider our plan.
2. Using a Multiple of the Estimated Losing Sequence as a Stop-Loss
If we know the win rate (win %), we can use an ELS calculator as a starting point and adjust the ELS by a multiplier to match our risk level:
- A) E.L.S. x2 – Strict Stop-Loss
- B) E.L.S. x3 – Moderate Stop-Loss
- C) E.L.S. x4 – Loose Stop-Loss
We call the ELS x2 a strict stop-loss since it only allows the strategy 2 statistically expected losing runs in quick succession. One ELS is almost certainly going to happen at some point, and if a second ELS comes soon after, it will mean we stop following this strategy and reconsider things. Again, it is quite strict since 2 ELSs in quick succession would be entirely possible and we should be prepared for this with our bank management as an absolute minimum of bank planning. This strict stop-loss is saying that we want to stop using this strategy because it is on a path that could be signaling that the trend is ending. It is not yet clear the trend is broken, but it is an indication that it might be heading that way, so some users may want to stop here and reconsider things.
We call the ELS x 3 a moderate stop-loss because it allows the strategy to have a few statistically expected losing runs, but once it reaches the end of a 3rd longest expected losing run, we feel it is indicating a break in the value trend and we should revaluate this. We feel this is a very reasonable and logical stop-loss level.
We call the ELS x 4 a loose stop-loss because we are allowing the strategy to have some bad luck (negative variance) and then have even more in the hope it will turn round and return to its trend line. The 4th losing run is when we accept defeat and the strategy has become excessively volatile and needs a rethink.
3. Using BOTH the MDD and ELS as a Stop-Loss
If we use the higher number of the MDD and ELS as our stop-loss then we can negate the weak points of each statistic on its own. The MDD’s weak point is that it is only as good as its data. If we have little data, then the MDD may be too low and inaccurate. Or even if we have over 1,000 bets worth of data, if the strategy has been unusually lucky (positive variance), then the MDD could be too low and unrealistic. The weak point of the ELS is that it uses the historical win rate of the strategy to predict future ELSs, but does not give us an idea of what a future Maximum Drawdown might be. It just estimates the likely longest losing run based on the win rate. If, for some reason, a strategy has been historically more volatile than the ELS suggests, then we can end up using an incorrect stop-loss figure. If we use both of these figures together, picking the larger stop-loss of the two, then we can be more confident that we have an appropriate stop-loss for our risk level.
An excellent way to plan your stop-loss is to make it a combination of both the historical MDD and the expected ELSs. In this way we can get a balance between historical reality and statistical expectations for the future.
Stop-Loss Examples
In our recent article we highlighted this Over 2.5 Goals strategy as being one of the best performing total goal strategies for 2023.
Let’s look at what Stop-Loss figures we get from the MDD and ELS.
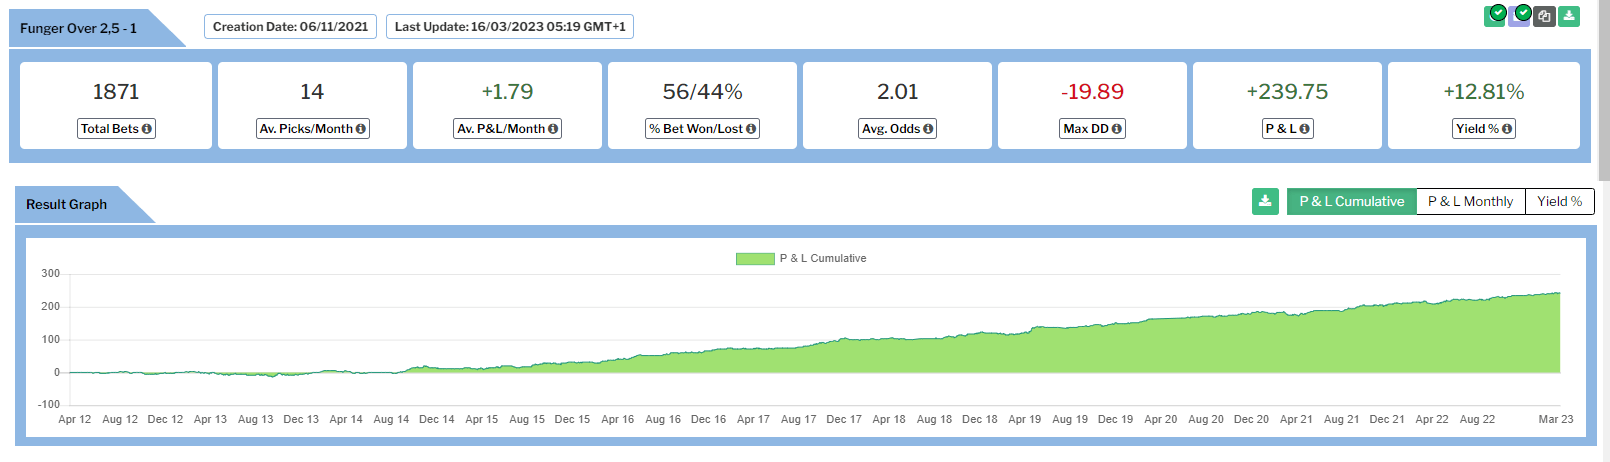
MDD = -19.89
Win Rate = 56%
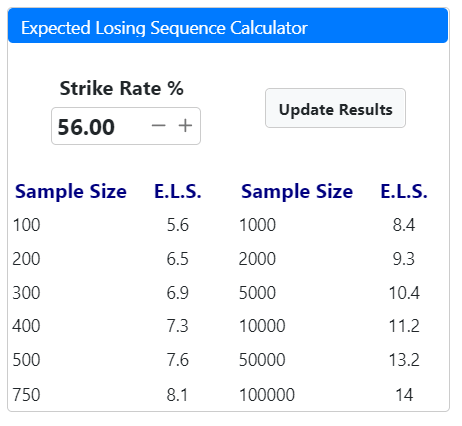
We see that the ELS for 2,000 bets is -9.3 points. We see that that the historical Maximum Drawdown after 1,871 bets is -19.89. That is just over 2 ELSs. In this case, the MDD is the ELS x 2.14 to be precise. Let’ s see how those drawdowns and ELSs match up for our 3 example risk levels.
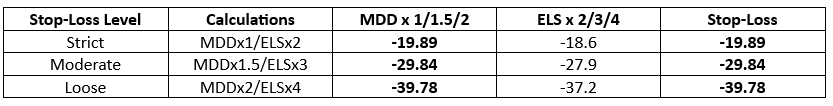
For the strict level, the MDDx1 is a bigger loss than the ELSx2. So this strategy has historically been a little bit more unlucky than 2 losing runs in a row. So we choose the bigger loss, the MDDx1 of -19.89 for the Strict Stop-Loss. For the other risk levels, the MDD figure is slightly larger. By using both figures, we also get an idea of how lucky or unlucky the historical results have been considering the win rate of the strategy.
We recommend the Moderate Stop-Loss, but it is up to each user to choose the stop-loss that matches their risk level. The Moderate Stop-Loss would mean that you keep betting until the strategy reaches a low of -29.84 on level stakes bets of 1 point per bet.
2. Away weak favourite 41 of 111 leagues 4%+ yields
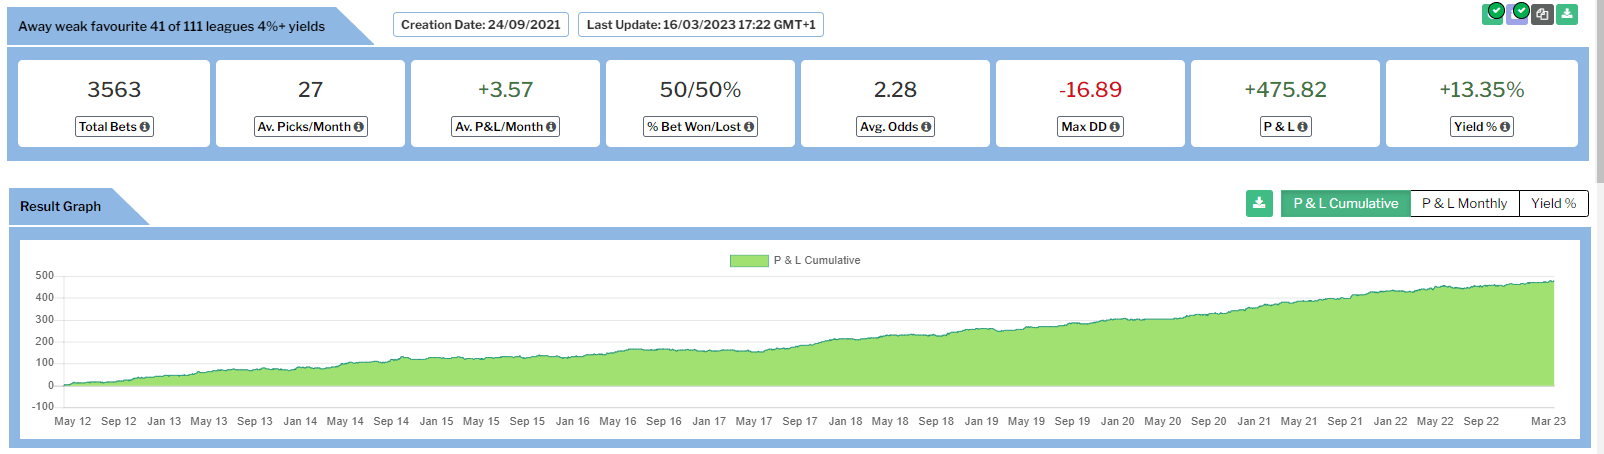
This top performing strategy has a lower win rate than Funger at 50% rather than 56%, but has a smaller Maximum Drawdown than Funger with -16.89 rather than -19.89. Let’s see what stop-loss we get here.
MDD = -16.89
Win Rate = 50%
We see that the ELS for 5,000 bets is -12.3 points. We see that that the historical Maximum Drawdown after 3,563 bets is -16.89. That is just over 1 ELSs. In this case, the MDD is the ELS x 1.37 to be precise. Let’ s see how those drawdowns and ELSs match up for our 3 example risk levels.
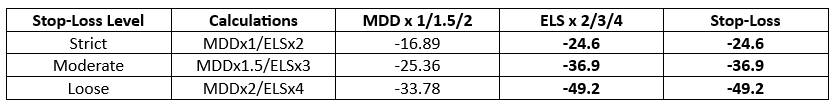
In this case, the ELS figures are larger losses than the MDD figures. This suggests that this strategy has been statistically lucky over its 3,563 bets. It is incredible it has such a low Maximum Drawdown. It makes this strategy very attractive to follow. From the win rate, we can expect losing runs that lead to losses of -36.9 for our Moderate Stop-Loss. One important thing to understand here is that we are saying that stopping at the MDD x1.5 of -25.36 might mean stopping too early. Stopping at that point may not actually be the sign that this strategy’s trend has stopped working. Its previous results have been statistically lucky, but based on the win rate, the trend could reasonably expect to have a loss of 36.9 before we should consider stopping it. In simple terms, just relying on the MDD x1.5 Stop-Loss in this case might mean giving up on it too early and missing out on profits. It is important not to give up too early on strategies, especially when they are going through a period of natural negative variance. That is the difference between short-term thinking, emotional gamblers and data driven smart bettors with a long term plan based on a full understanding of the statistics.
3. Pro-Home
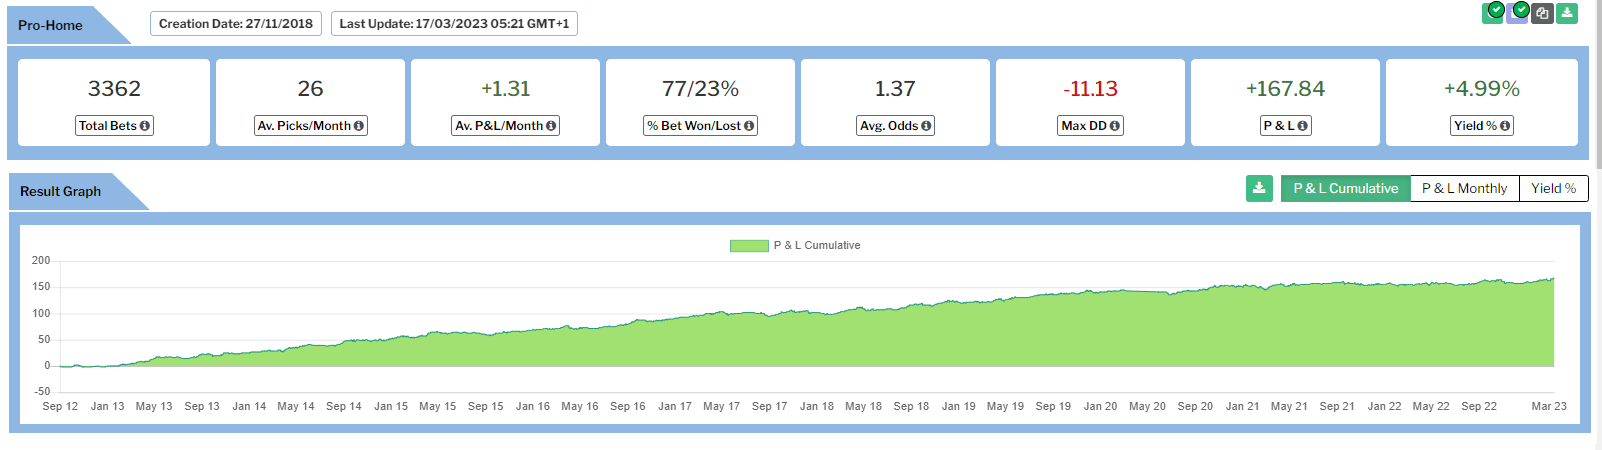
This strategy backs home favorites, so we have a much higher win rate of 77% and a smaller maximum drawdown of -11.13. This will equate to a smaller stop-loss.
MDD = -11.13
Win Rate = 77%

We see that the ELS for 5,000 bets is -5.8 points. We see that that the historical Maximum Drawdown after 3,362 bets is -11.13. That is about 2 ELSs. In this case, the MDD is the ELS x 1.92 to be precise. Let’ s see how those drawdowns and ELSs match up for our 3 example risk levels.
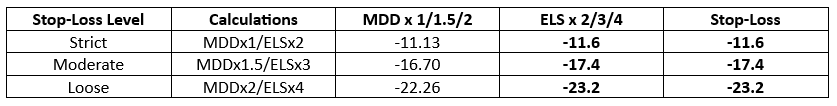
Here, again, we see that the ELS multiples give a slightly larger drawdown than the actual MDD multiples, but just by a little. So we can use this figure as our stop-loss. For the Moderate Stop-Loss we would stop the strategy when it reaches a loss of -17.4 points on 1-point level stakes.
Time vs Number of Bets
Note that in none of these examples do we consider stopping a strategy because it has not produced profit after X number of bets or after a specific period of time.
The problem with using time as a factor in when to stop using a strategy is that the trend has nothing to do with time, it is to do with the number of bets. Some strategies produce 10 bets per month, some strategies produce 40 bets per month. So after 3 months we have 30 bets from one strategy and 120 bets from the other. The profit of each strategy cannot easily be compared since they have different amounts of data to judge by. In terms of performance, we can compare them to an extent using yields to see which strategy has been more profitable in the time period, but 5% yield from 30 bets and 5% yield from 120 bets does not mean the two strategies are as good as each other. The strategy maintaining a 5% yield after more bets has more data to support its trend, so we would view that strategy as more dependable and consistent.
Again, using time as part of the stop-loss calculation does not make sense since there are months with fewer games and also periods when the strategy will not find as many selections as usual. So we should avoid considering time as part of the stop-loss.
Using the number of bets is a better way to think of “time” for a strategy. If we compare 2 strategies over their last 100 bets to see what profit they made, this is a much fairer comparison. For strategies, the number of bets is their “time”.
But then please note that number of bets also does not really connect with a stop-loss. The stop-loss is to tell us when a strategy’s trend has stopped working, or, if we choose a stricter stop-loss than the MDD, one that tells us the point we have chosen to stop following the strategy. So if a strategy goes on for many bets without going into a big loss, but not going into the expected profit either, then the stop-loss will not be reached, but we might consider that the trend is not as strong as before and want to switch to another strategy. For example, a strategy that was producing 5% yield from the previous 1,000 bets then goes on to produce only 1% yield from the next 1,000 bets. In this case the trend has not stopped working, since it is still beating the bookmaker margin, but it is not as strong as before. In this case we can use a number of bets as the “time” that we will give the strategy chance to repeat its historical trend. We strongly recommend that users should consider 1,000 bets or more as a sufficient amount of time to give a strategy. Just following it for 100 bets does not really give a strategy chance to show its historical trend. This is why we need to make plans for each strategy we follow.
Planning a Betting System
When we choose to follow a system, we need to plan how much we hope to win if the historical trend repeats itself. We can do this by looking at past results and then applying our staking plan to it and seeing the results after costs. But we also need to have a Stop-Loss that tells us when to stop following the strategy. This stop-loss can be based on looking at the Maximum Drawdown and also the Expected Losing Sequence from the Win Rate. We can also then plan how many bets we will follow the strategy for and give it a chance to repeat its historical trend.
Gamblers Doubt vs Big Data Bettors Confidence
Once we have made a plan, then we should let it run. We do not need to worry about weekly results. We do not need to second-guess and doubt our plan after one ELS. That is turning back to the gamblers mentality of always having to be “on” and actively checking bets in-play to see if we are making the right decisions. Value betting is advanced betting. The data gives you the power to be confident in the plan you have. If you plan your Start Point and Exit Points well, then it should reduce the stress of wondering if the weekend’s bad results mean the strategy isn’t working. Just check back to your plan. How much are you expecting to make? What is your stop-loss? How many bets are we letting the plan run for? If we are still inside those figures, then we can keep going.
The Importance of a Stop-Loss
Do you have stop-losses planned for your strategies? Take a look now to make sure your plan is in place.
We hope this article has given you a better understanding of how you can use the data available in the Betamin Builder to make clear and easy to understand stop-loss points for your betting strategy.
Sign Up for free to access the Betamin Builder here.
See the Top Over 2.5 goals profitable strategies for 2023
Read more about The Best Betting Strategies of 2022
Learn how to automate Betaminic strategies with a betting bot.
Access Betlamp, the amazing free statistics tool here.
Read more Betaminic posts here.