5 Steps to Create a Customized Set of Efficient Betting Strategies

Make your set of strategies more efficient to run by customizing them to avoid overlaps.
As you edit them, get a better understanding of the core settings and get inspired to create better strategies for the future.
Big data betting works best with a portfolio of multiple strategies that smooth out each other’s losing runs into a smoother upward progression. More strategies also means a high velocity of bets and moving towards targets quicker. But some strategies overlap with each other and sometimes produce similar picks. This article shows a way of customizing your set of strategies so that they fit together more efficiently, so you can follow your system longer for the same cost.
FIVE STEPS TO MAKE A CUSTOMIZED SET
- Select your top Betaminic strategies.
- Note which leagues and odds bands each strategy uses.
- Choose your CORE and SECONDARY strategies.
- Edit the SECONDARY strategies’ leagues or odds bands to fit together with your CORE strategies.
- Create and follow your new customized set in the Betamin Builder.
STEP 1 – Select your top Betaminic strategies
First you need to choose which strategies you want to have in your set. You can rank the strategies by different values in the Betamin Builder.
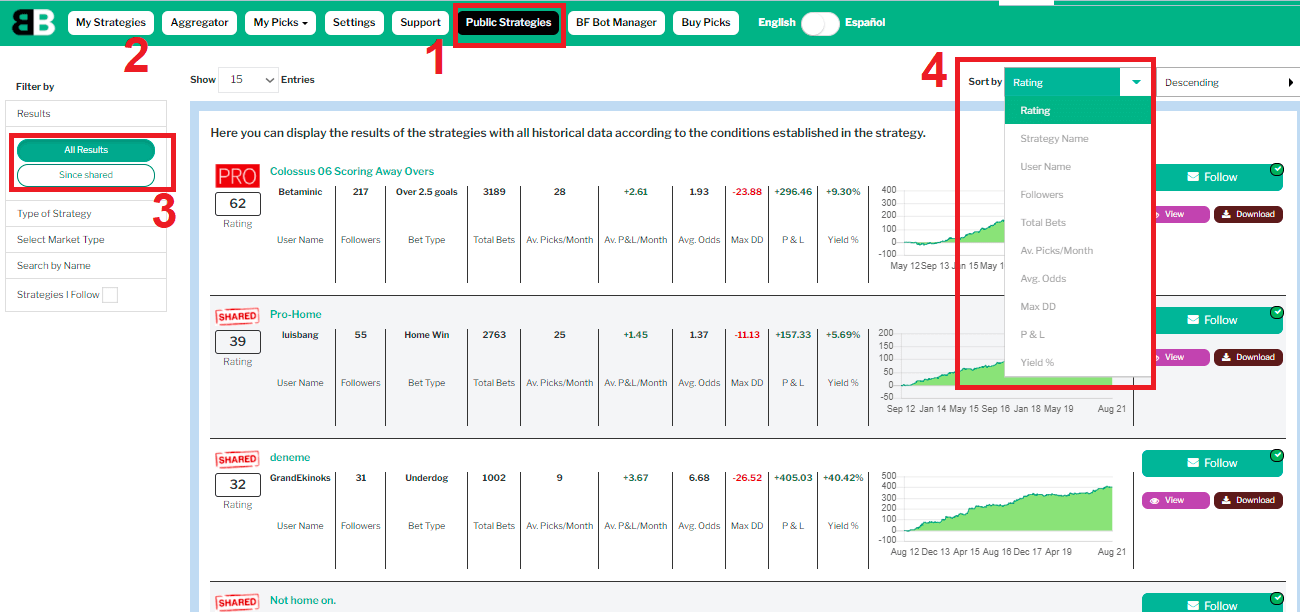
You can look in the “Public Strategies” (1) or your private “My Strategies” (2) area for strategies to choose from. Then you can choose to look at “All results” or their “Since Shared” results. When a strategy is created, it uses all the available data as research data to find trends that show profit. After a strategy is created and shared, its new results from fresh data from after being created are in the “Since shared” results. So, in the simplest terms, the “Since shared” results are the proof of if a strategy’s researched trend continued or not. Strategies that have a lot of profit “Since shared” have strong trends that continued after they were found in the research stage. So a good place to start is by ranking strategies by their profit and loss in their “Since created” results. The Betaminic rating is a statistical figure of how likely this trend is a true pattern and not just a lucky run. The higher the number, the stronger the pattern. The “All Results” data includes both the “Since Shared” data and all the previous data that was used in the research stage. When choosing which strategies you want to use, also consider the yields, the average odds, the win rate and the maximum drawdown. These are all important figures that give you an idea of the nature of the strategy.
The yields give an indication of the Return On Investment or ROI that has been generated so far per pick with this strategy. So a 10% yield is a significant edge on the bookmaker odds, but a 1% yield is much smaller, and would need larger stakes to cover the costs of the picks and still make profit. Professional gamblers often look for yields over 4-5% as being a good baseline to choose strategies from.
The average odds and the win rate give an indication of the natural variation that can be expected from the strategy and the staking levels that could be used. If a strategy has average odds of 1.37 and a win rate of over 78% (the “Pro-Home” strategy) then after 100 bets I would expect to experience a longest losing streak of at least 3 games. I can put the win rate into this ELS calculator from the Staking Machine website to see instantly how long the expected losing runs might be. For higher average odds, such as 4.85 and a win rate of 29% from the “”Away wins” strategy we can expect a longest losing run of nearly 14 losses in a row in just a 100 bet period. As a safe rule of thumb, your staking levels should be able to handle 3 or even 4 of these longest losing runs in a row to avoid going bankrupt.
The Maximum Drawdown is also a very important figure to look at when considering staking size. This shows the cumulative worst losing runs. So for the “Pro-Home” strategy, it has a Maximum Drawdown of 11.13. This suggests it had a losing run the equivalent of nearly 4 ELSs (ELS 3 x 4 = 12). Very cautious bettors may even consider adjusting their stakes to allow for the Maximum drawdown being doubled. So in the case of Pro-Home, you could bet 4% or 8% of the bank on each pick, depending on your risk level. For the “Away wins” strategy, the Maximum drawdown is 41.65. So stakes should be much lower on that, 1% or 2% of the bank depending on your risk level.
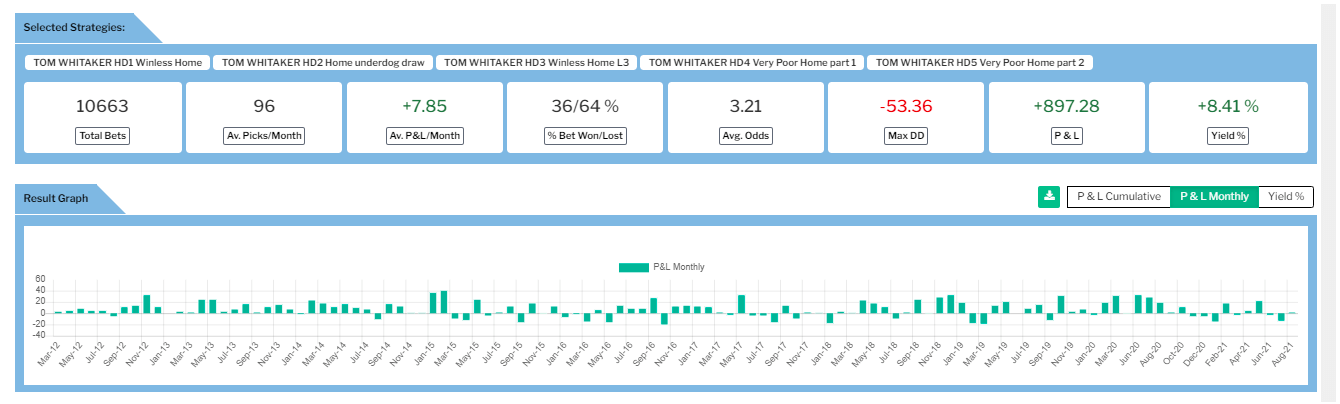
Also look at the profit graphs and monthly P/L bar charts for each strategy you want to include and see if they are showing a smooth increase or if they had one good month and lots of bad months. Of course, smoother upward progressions are better than strategies that were initially continuing their trend but have later been on a downward trend.
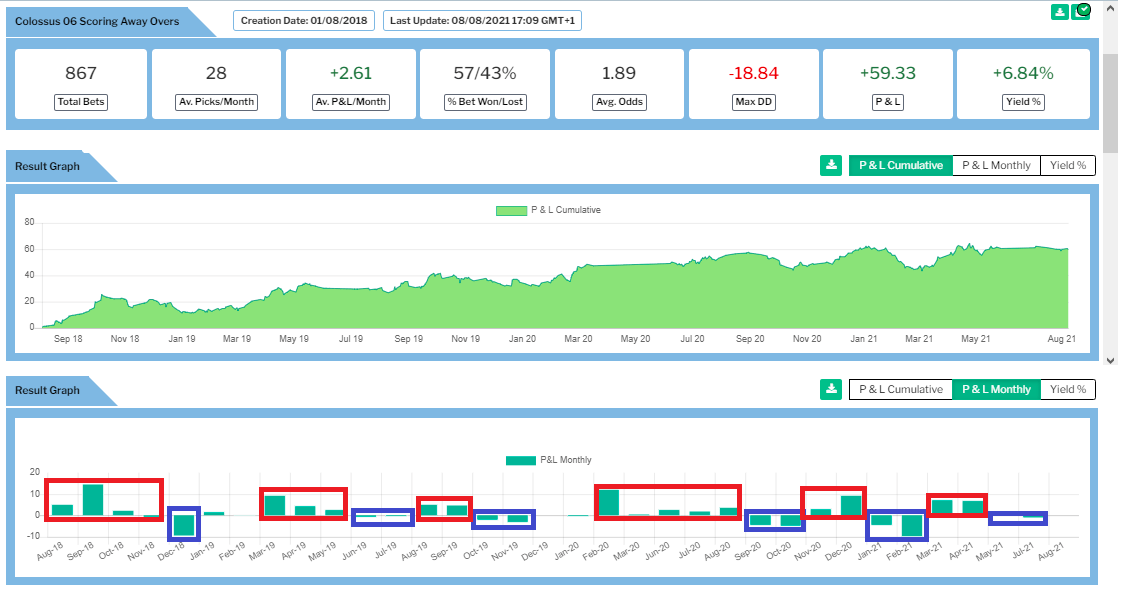
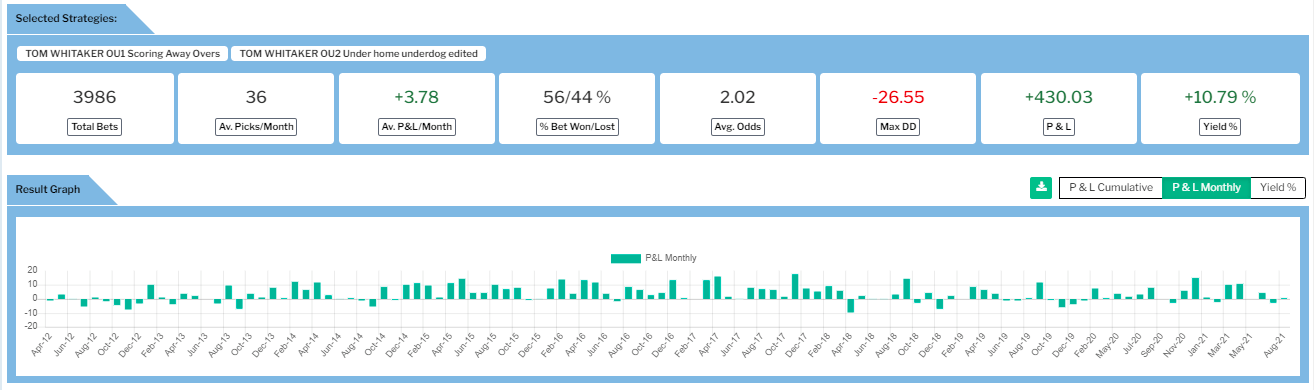
This image of the “Colossus 06 Scoring Away Overs” shows how even the longest running and most successful strategy has losing months and following this strategy just after 2 winning months often means you are catching the down swing variance. It suggests that starting to follow this strategy after 2 losing months gives you more chance of catching upward swings in variance. The long term progress is upward. So you should also not discount strategies just because they have just had a losing run since they is often just a negative swing of variance in the natural trend before returning to upwards to its trend line. This suggests that now is the best time to start following the Colossus 06 Scoring Away Overs if you are not already. It is also the worst time to stop following this strategy is you started 2 months ago and are feeling like giving up. Big data betting is a long term strategy and stopping and starting due to short term results can lead to following losers and backing winners. So it is important to pick strategies based on their long term results and not recent results.
Once you have a list of the top Betaminic strategies that you want to put into your system, go to the next step.
STEP 2 – Note which leagues and odds bands each strategy uses
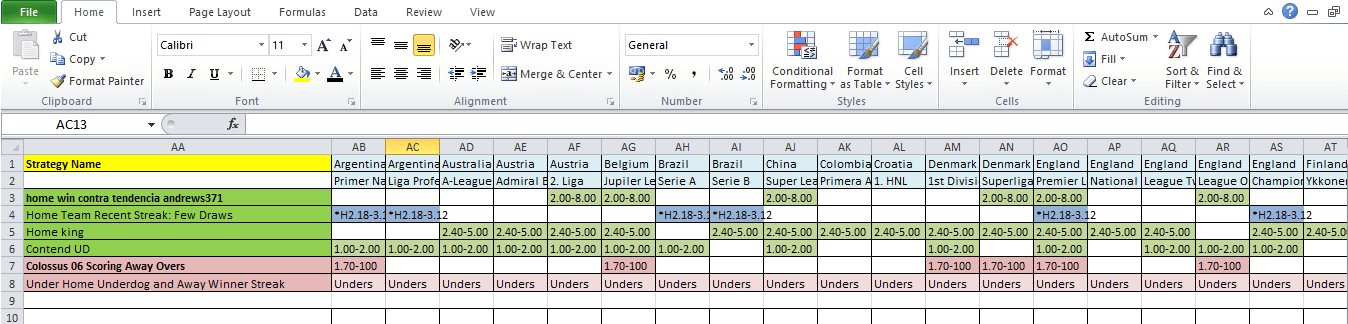
In order to fit strategies together, you need to know which leagues and which odds bands each strategy is betting on. This is easier to do in a spreadsheet such as excel if you have it. You can make a note of the odds band used in each league. Giving a colored background to each cell depending on its bet type can help when editing leagues later on, since it lets you see overlaps more easily.
STEP 3 – Choose your CORE and SECONDARY strategies
Once you have the strategies that you want to use together, select a CORE strategy for each bet type. For example, one CORE strategy for Match Odds bets and another one for Over/Under 2.5 goals markets since these do not directly overlap. If you do not mind having bets on both the win and the draw in the same match, you can have 2 core strategies for Match Odds, one for the home or away win and another for the draw bet. Or alternately, you can have just one core strategy for the Match Odds market.
When considering your Core strategies, you want to select strategies that have the highest profit per month or by Since Shared P/L (which are factors of the yield and bets per month), since these will be in your set unedited. So if it has few bets with just a little profit per month but blocks off most of the leagues, then it is not an efficient system.
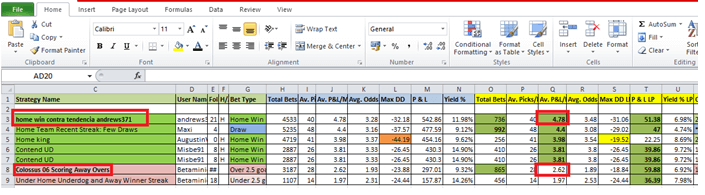
In this example set, we use “Home win contra tendencia andrews371” as a core strategy with home bets for the Match Odds market and “Colossus 06 Scoring Away Overs” as a core strategy for the Over/Under 2.5 goals market. Each of them has a high Average P/L per month compared to the other strategies being considered.
STEP 4 – Edit the SECONDARY strategies’ leagues or odds bands to fit together with your CORE strategies
The next step is to edit the remaining secondary strategies as much as possible to fit into the league and odds band gaps around your core strategies. The secondary strategies can also be ranked by monthly profit and loss or by Since Shared P/L.
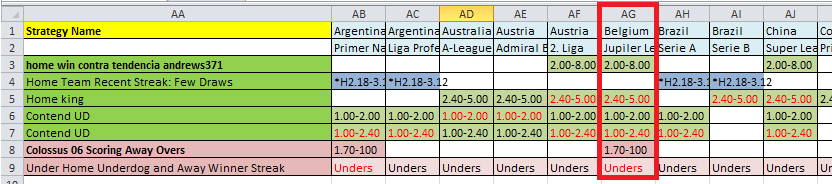
In this example set, if we look at the Belgian Jupiter League, we see the core strategy “home win contra tendencia andrews371” uses this league by betting on home odds between 2.00-8.00. So it takes precedence over all the other strategies. Then the secondary Home King strategy also uses the odds band 2.40-5.00 so that cannot be edited to fit with the core strategy. In this league it is cut out. So in the spreadsheet we can change the text to red so we know that we will exclude this league to avoid overlap between strategies.
The next secondary strategy we chose in the example set is “Contend UD”. This strategy actually used the odds band 1.00-10.00 which overlaps the core strategy in the 2.00-8.00 band. So in theory, if we edit this strategy to only bet on odds of 1.00-2.00, it could fit in with the core strategy in leagues where they both bet on. A higher ranking secondary strategy “Home team recent streak: Few Draws” also used the odds band 2.18-3.12 so we also do not want overlap there. There are also leagues where “Home King” is betting on the odds band 2.40-5.00. So we could even split the Contend UD into a part 1 and a part 2. One of them betting on the odds range 1.00-2.00 and the other betting on the odds range 1.00-2.40. In this way we could fit the Contend UD strategy into leagues which other higher ranked core and secondary strategies are betting.
For the Over/Unders market, things are easier as we simply edit the “Under home underdog and Away winner streak“ strategy to cut out leagues that our core “Colossus 06 Away Scoring Overs” is already betting on.
By going along the notes of leagues used and odds bands, we can make notes on how to fit together the core and secondary strategies by:
- Cutting out leagues
- Editing odds bands
- Splitting strategies into parts that cover different odds bands
STEP 5 – Create and follow your new customized set in the Betamin Builder
After you have decided how your strategies can fit together, the next step is to re-create them in your own “My strategies” private area and then follow those strategies.
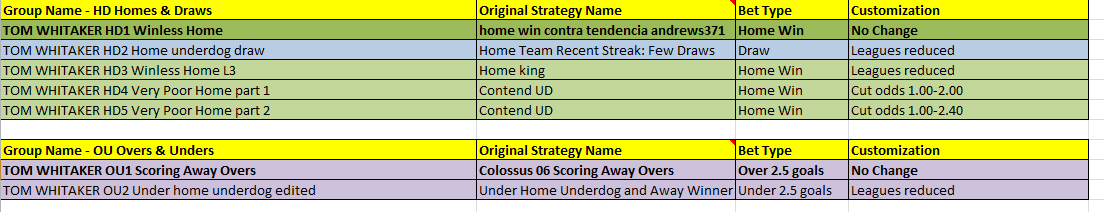
In the example set above, we have named them HD1-5 for “homes and draws” and OU1-2 for “Overs and Unders”. Each set does not overlap so they have different set names.
When you are recreating the strategies, it gives you a chance to give them new names that you can understand and recognise as being part of the same customized group. Then your pending picks will make more sense. Since the core strategies are being used unedited, you do not need to re-create those ones unless you want all your strategies to have the same name style.
Be sure to make notes of your original strategies so that you know how they were created and what edits you made to them. Then, if you want to refer to their original strategy results on the Public Strategies page, it is possible to do so.
As you re-create your strategies you will get a deeper understanding of what kind of strategies you are following and might get inspired to create your own new strategies. If you do get new ideas for strategies, please do share them. New ideas now can grow into proven strategies a few months later.
These above example strategy sets were created by Tom Whitaker. They have been shared on the public strategies page if you want to look at how they were made and you can follow them if you want. There is also a YouTube video that shows how he made them. These example strategies were made in August 2021 with the latest data. Back at the end of April 2021, he also made a customized set of 18 strategies that fit together in an efficient portfolio. That set is called the BSG-18 and is also available on the Public Strategies page to view or follow.
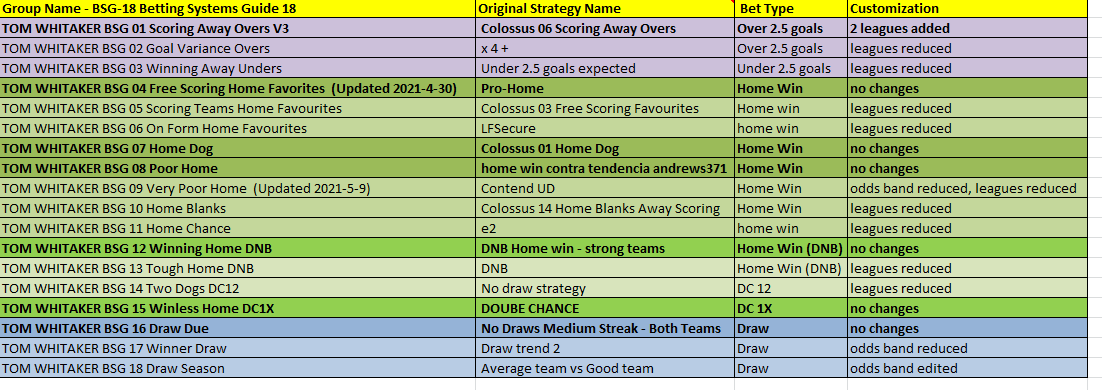
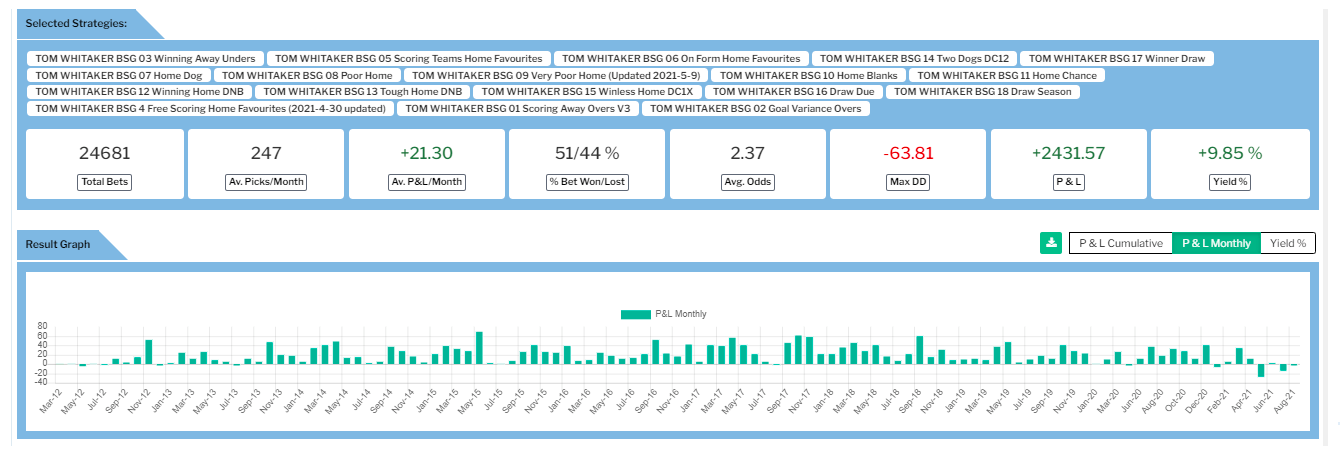
This manages to take 18 strategies that would have needed 364 picks per month and reduced it to 247 picks per month. Over the long term that is a significant saving of picks and in big data betting, long term planning is important, so any efficiencies that can be made can really help towards reaching your goals and improving your system.
Of course, it is not necessary to follow all these strategies, and you can select a few strategies from this set which will also not have any overlaps.
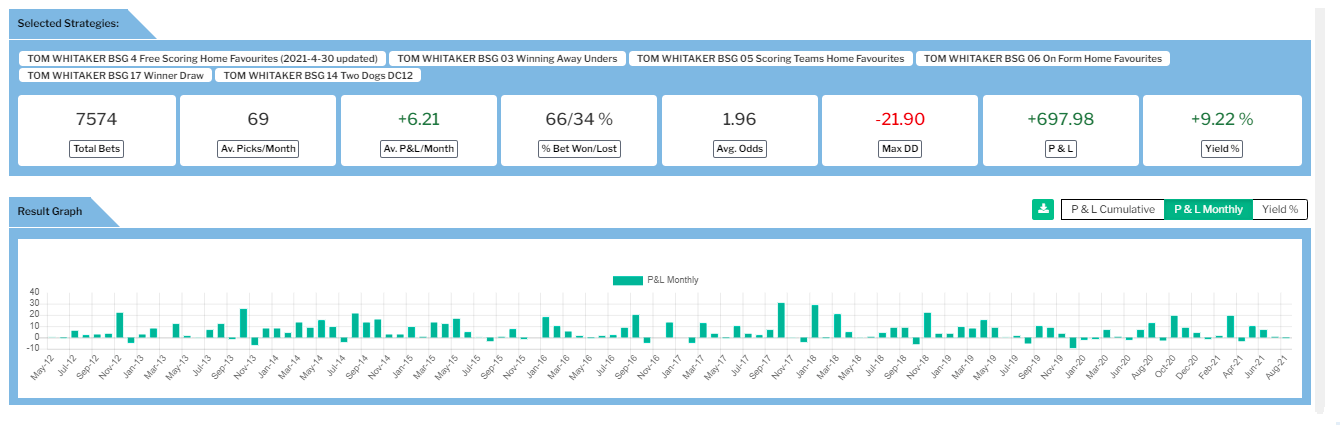 This set just has 6 of those 18 strategies and creates a much lower drawdown version of the set. (BSG 3, 4*, 5, 6, 14 & 17) (*BSG4 has been updated, note the newer version.)
In conclusion, by creating customized sets of strategies, you can reduce pick costs, prevent overlaps, get to know your strategies better and even be inspired to create new strategies that could be even better.
Sign Up for free to access the Betamin Builder here.
Watch the video explanation of this article on YouTube
Access Betlamp, the amazing free statistics tool here.
Read tips on how to improve your yellow card betting
Discover 6 free strategies that can be used with Betlamp Football Statstics.