Learn all the necessary steps to create strategies as profitable as the one we will show you with the help of Betamin Builder. Choose the filters you want, analyze the graphics and review the summary data of the strategy before saving your strategy.
Create strategies in a few minutes looking for trends that have worked in the past, checking the Max Drawdown obtained to try to minimize the risk and seeing the evolution of the Result using three different types of graphs.
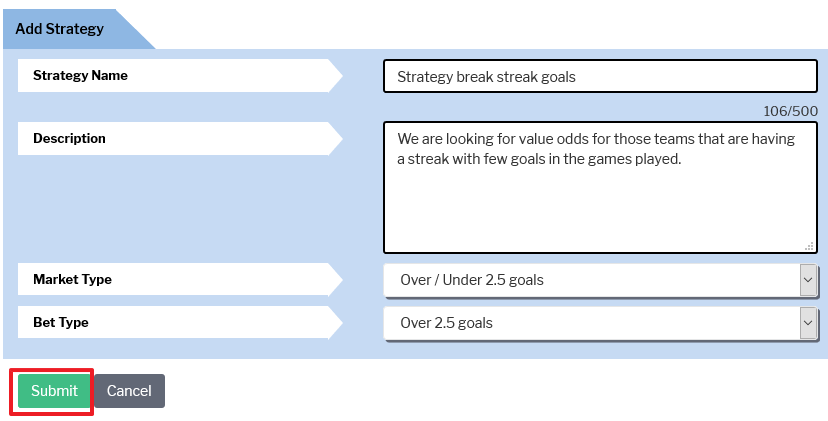
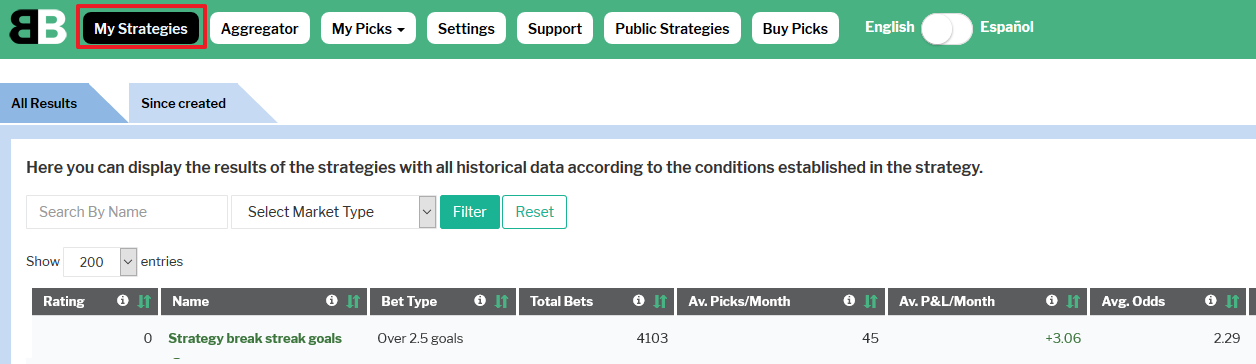
The first thing is to have an idea about the strategy to create. In our case, we will create a strategy that looks for teams that do not have a high percentage of Over 2.5 goals in the season, obtaining long-term value odds. To start creating the strategies, we access Betamin Builder and in the “My Strategies” section, we click on “Add Strategy”.

We choose a name for the strategy, as well as a description that allows us to remember the logic behind the system we want to create. Select the Market and the Bet type, and click on the “Submit” button.
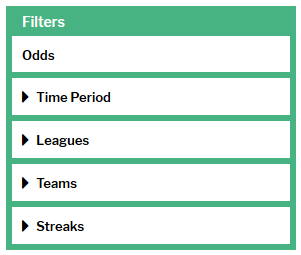
To the left of the screen, you will find all the filters with which you can create a wide variety of conditions.
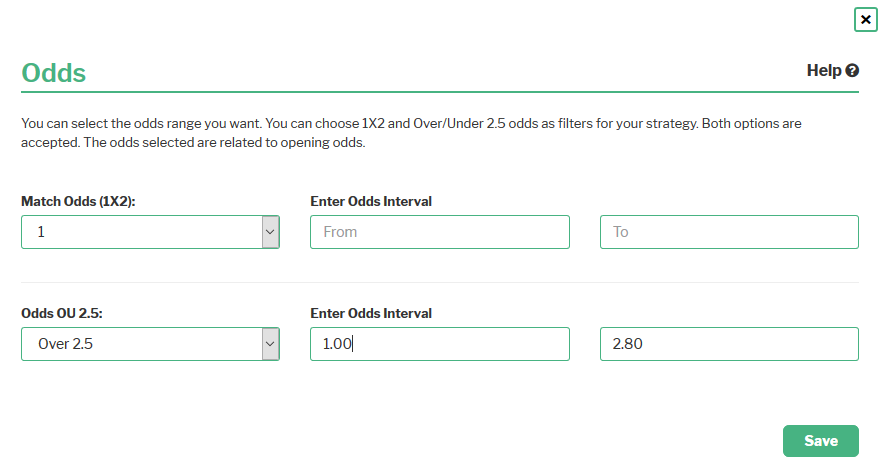
In our example, we will first select the odds, discarding the very high odds of Over 2.5 goals to try to reduce the bad runs of the strategies. We choose the odds less than or equal to 2.80 and save the filter.
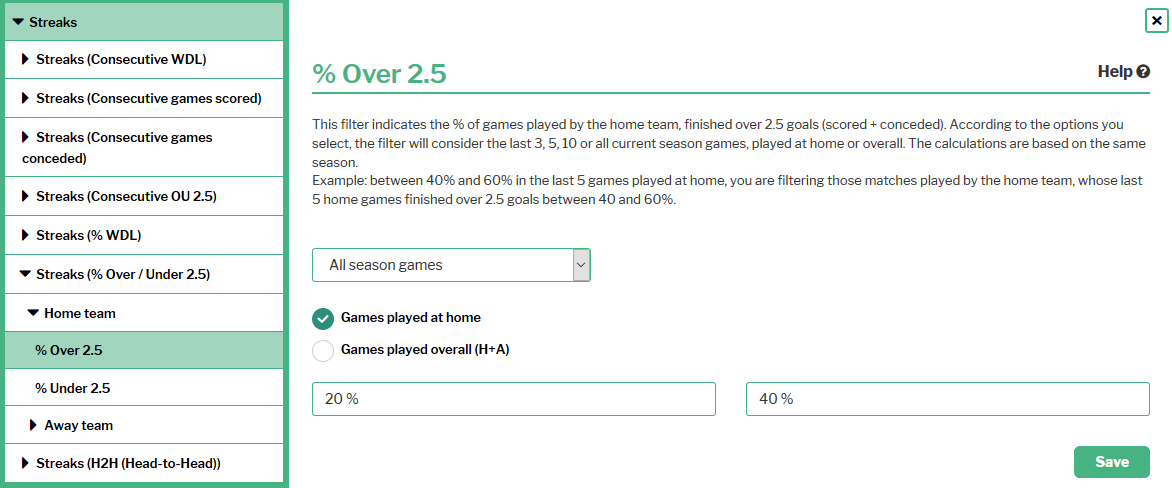
Now we select the streak filter. We filter those games where the home team has finished their home games over Over 2.5 goals between 20% and 40%.
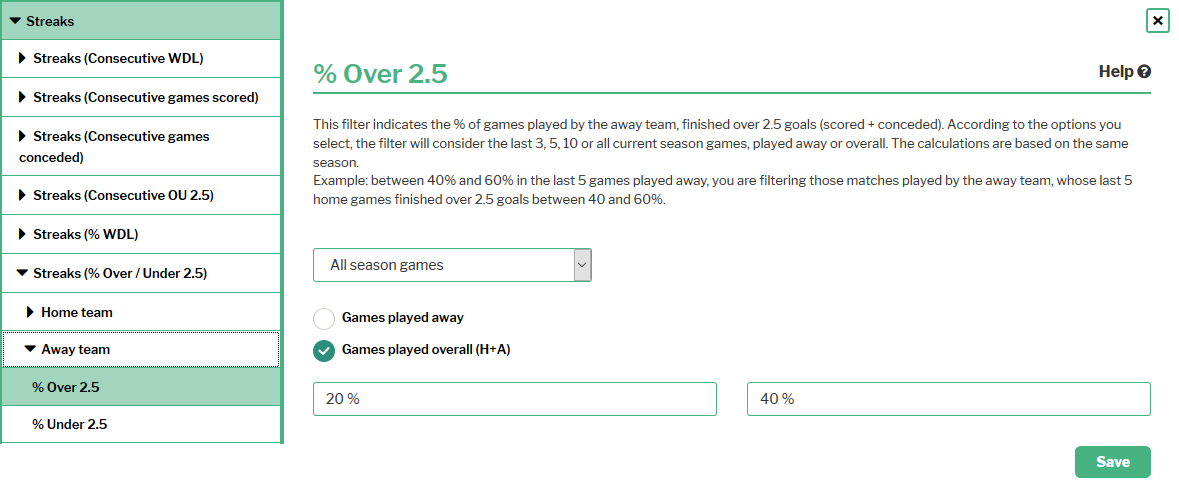
We repeat the same filter for the away team, but this time we choose all the games played.
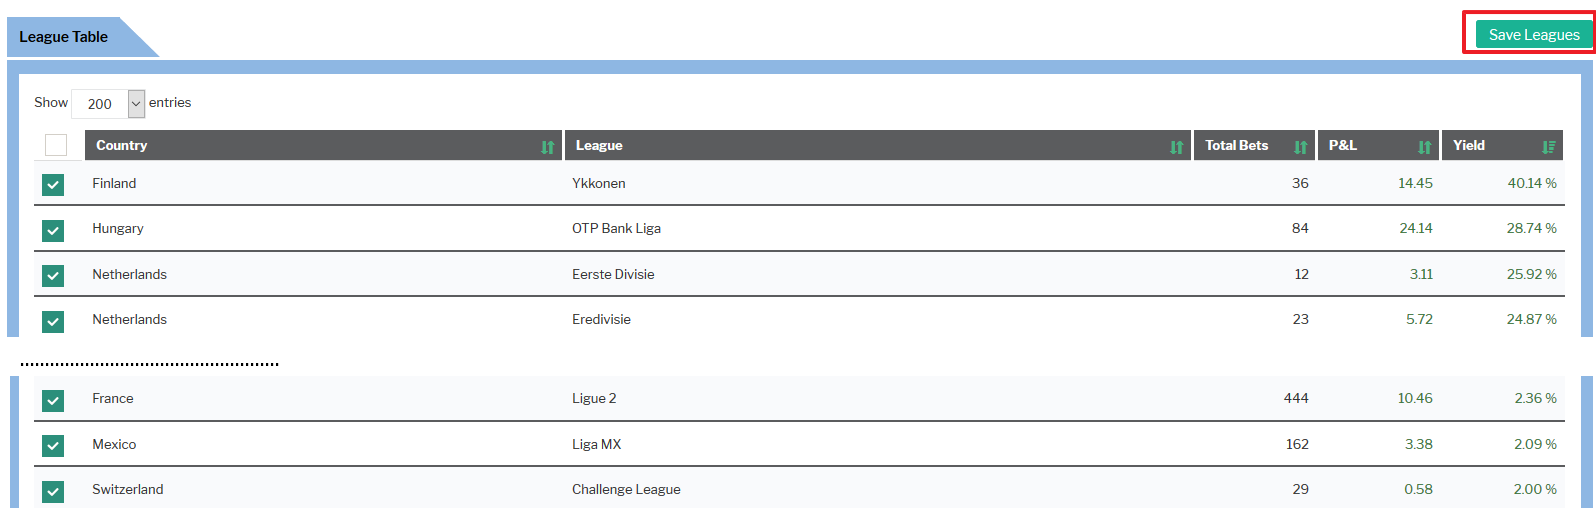
Now we select all the leagues that have obtained at least 2% profitability in their history, discarding those that have not obtained good results, and therefore do not ajust to the conditions established in the strategy.
At the top, you can see the summary of the strategy data:
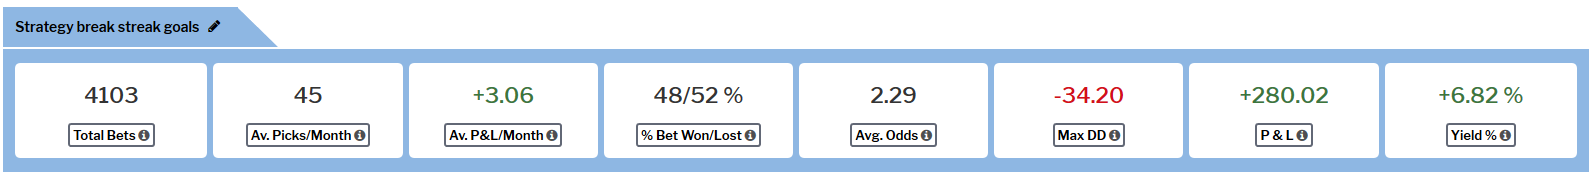
Profit and Yield are as important as Max Drawdown, as it is a fairly significant indicator of strategy risk.
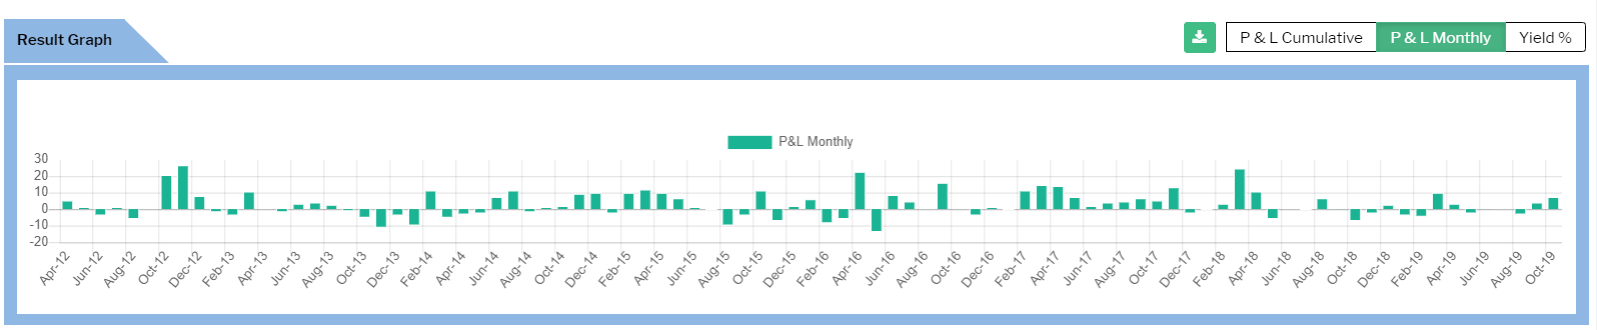
You can also see the different results graphs, to check the evolution of the strategy during the entire period analyzed. In the Cumulative Result graph you can analyze in a global way the behavior of the strategy.
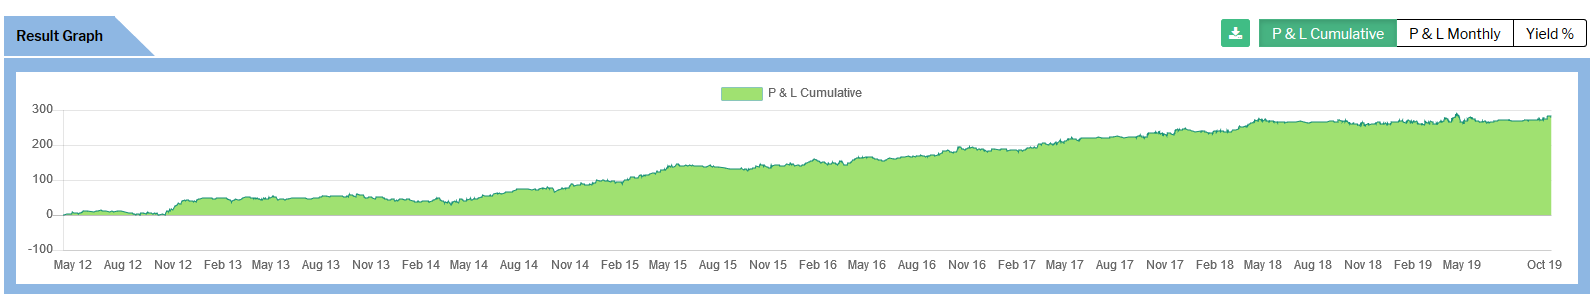
Through the monthly chart you can see the individual result of each month to check the details of every month.
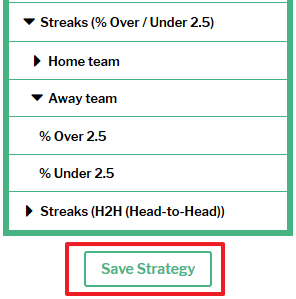
Finally, we must save the strategy. We click on the “Save Strategy” button located on the left, below the filters.
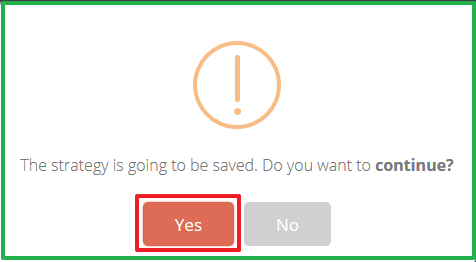
We confirm that we want to save the strategy.
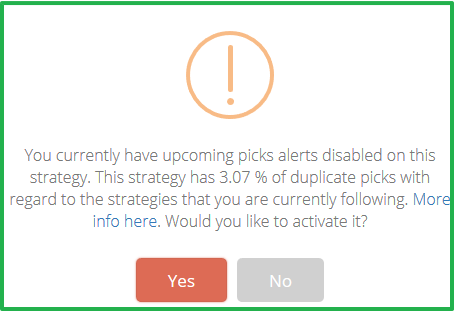
Finally, if you want to receive the strategy picks (Premium Option) you must activate the option. In case there are duplicate picks with respect to other strategies that you follow, you will be notified by a message. In this case, there are 3% of picks that are repeated from other strategies that we follow.
That’s it. The strategy would be saved, and should appear in the “My strategies” section.
If you have any questions in the process, you can contact us through the contact form or by email to su*****@*******ic.com and we will respond as soon as possible.