The Best Football Statistics and Historical Odds Data for Betting Analysis

Now you can see and manipulate the latest football statistics in the most easily accessible interactive charts and graphs on Betaminic.com’s new statistics page.
This fantastic free tool is an interactive chart that shows data from 54 leagues around the world since 2012, updated daily. You can filter the data by season, country, league and even by team.
The charts show:
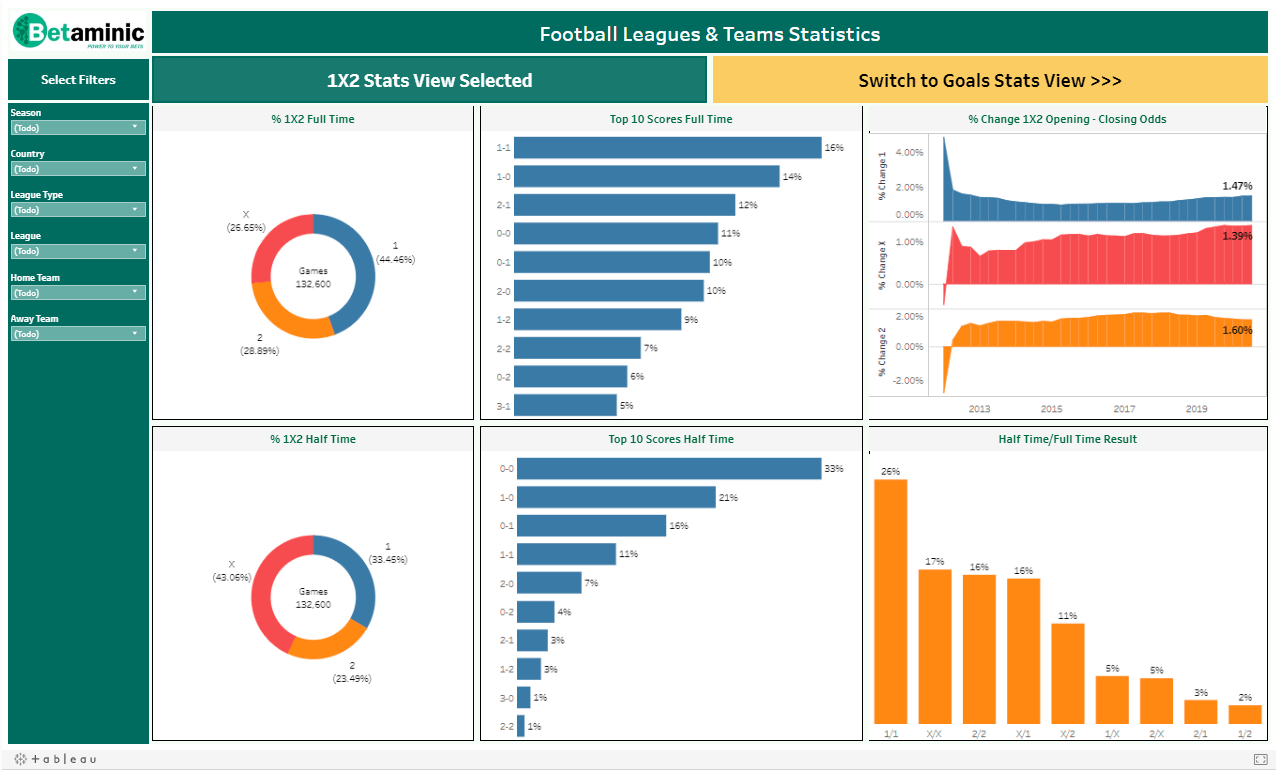
1X2 Match Odds Statistics
- Full time and half time results as percentages in pie charts.
- Top 10 scores at full time and half time as percentages in a bar chart.
- Change in match odds prices from opening odds to closing odds as an average percentage in a graph.
- HT/FT results as percentages in a bar chart.
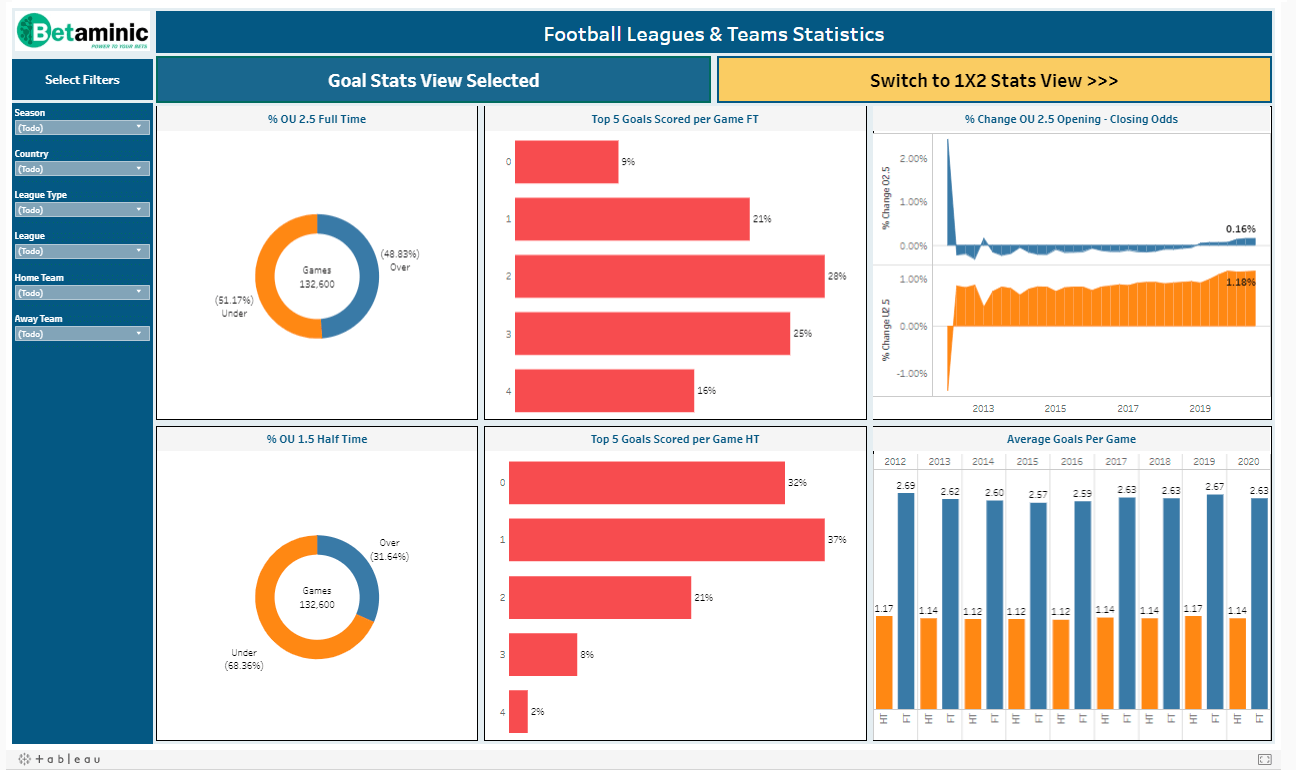
Goals Statistics
- Over 2.5 goals at full time data as percentages in a pie chart.
- Over 1.5 goals at half time data as percentages in a pie chart.
- Top 5 total goals figures at full time and half time as percentages in bar charts.
- Change in total goals odds prices from opening odds to closing odds as an average percentage in a graph.
- Average goals at half time and full time per game per season shown as a bar chart.
The visual layout makes it easier than ever before to see the whole picture on one screen and instantly get a good overview of trends. You can then use the filters to refine and research the data to analyse specific areas of interest. Once you notice a trend and get an idea for a betting strategy, you can even test it with actual historical bookmaker odds in the Betamin Builder tool to see if that betting strategy would have led to profit.
Interactive and Highly Customizable: See Trends Easily
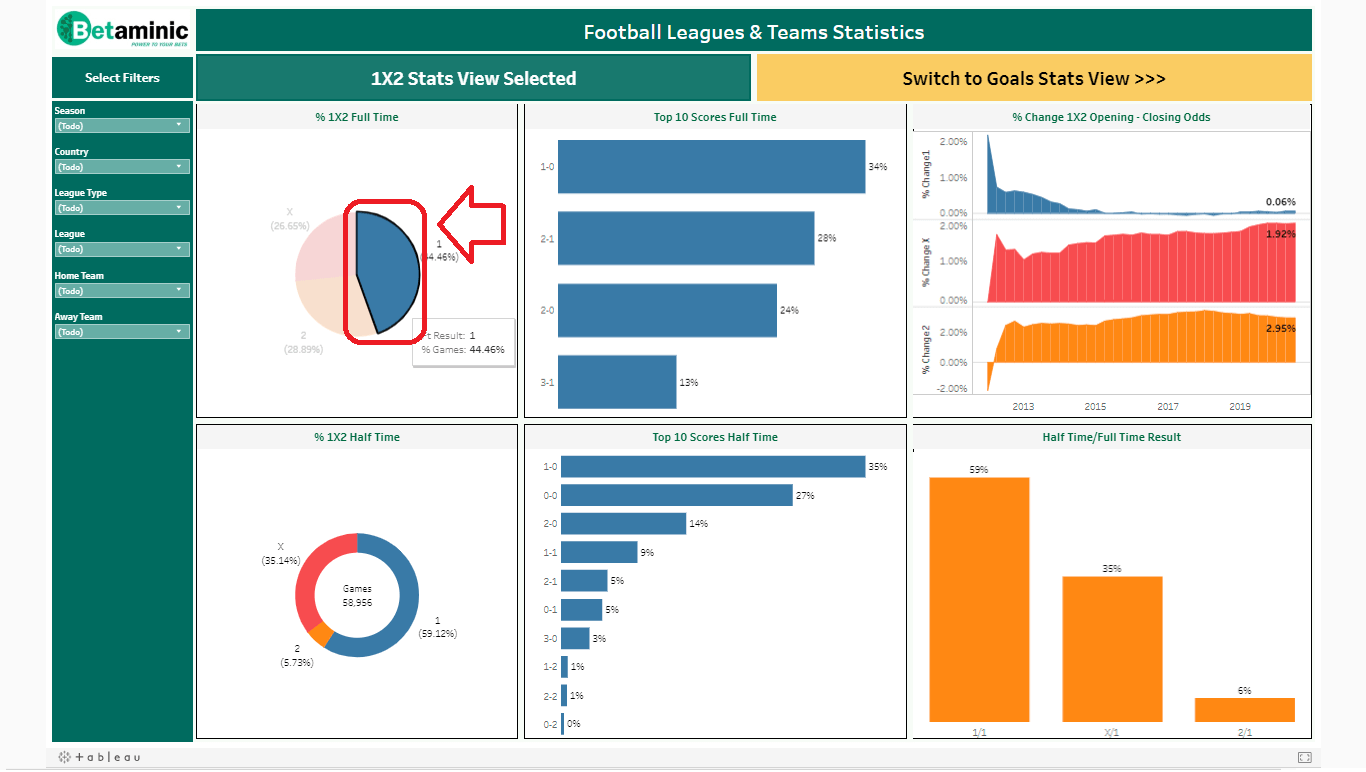
By clicking on various parts of the chart, data can be quickly filtered to reveal new trends.
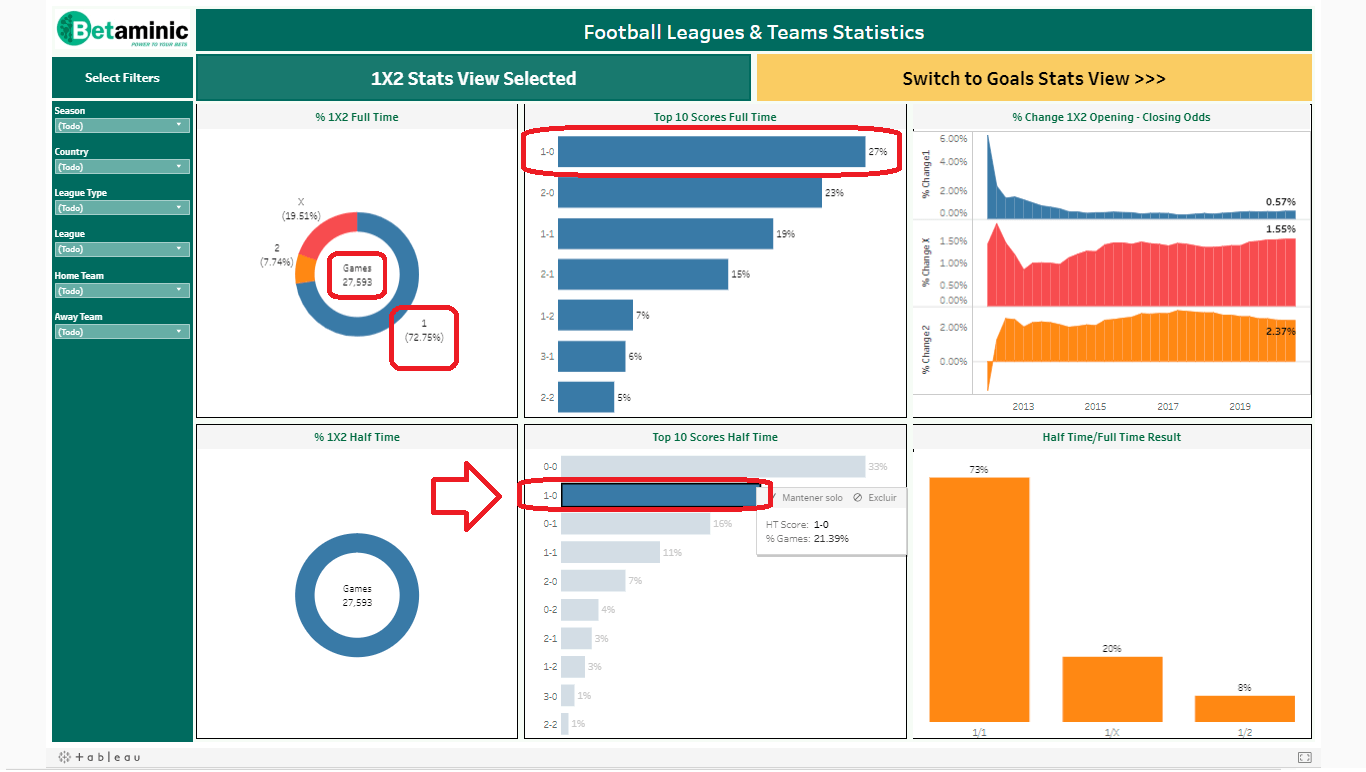
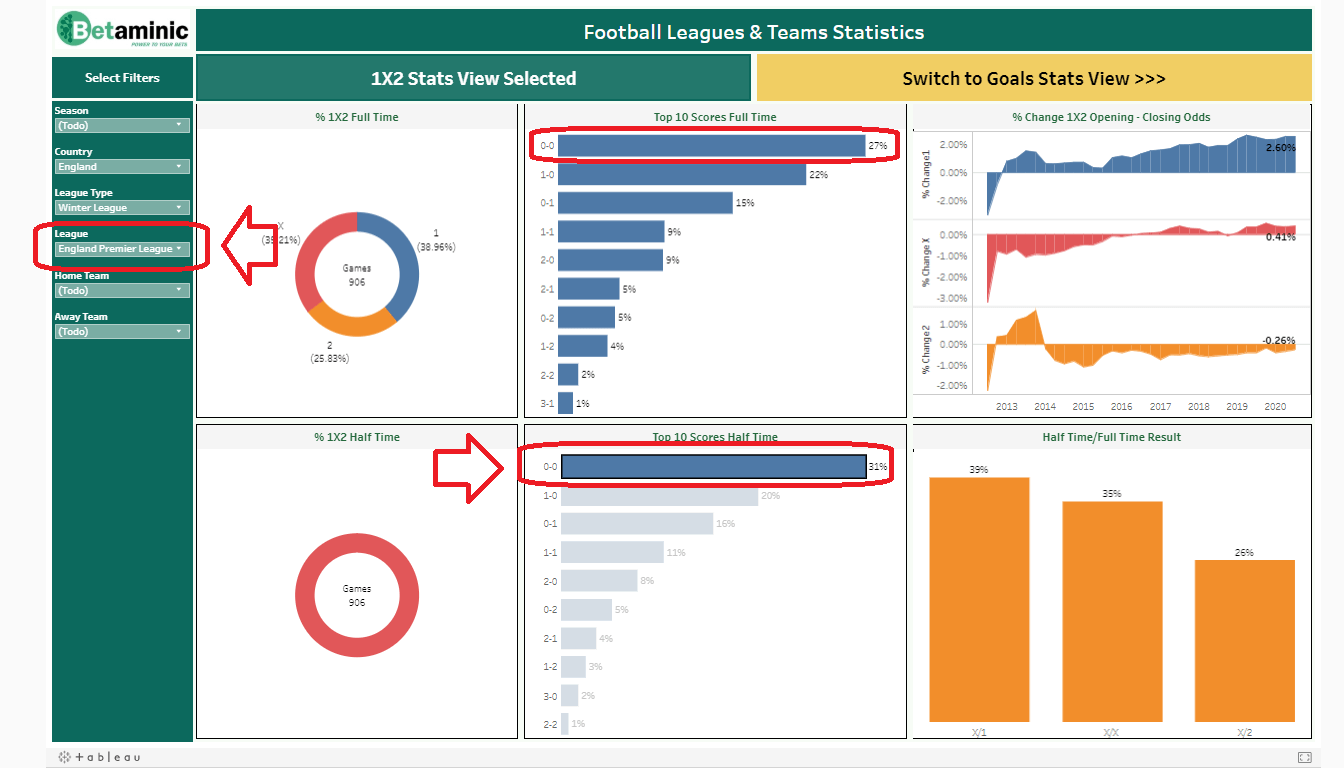
For example, if we click on the blue “1” slice of the 1X2 full time match result pie chart, it will filter down to only the matches that ended with a home win. Here we can see that the majority of home wins ended 1-0 and 2-1, so it can give us the idea to research if it is more profitable to split a stake on a home win bet into 2 correct score bets of 1-0 and 2-1 respectively. (The red arrow points to the area that was clicked on.)
Half Time Statistics: Useful For In-Play Betting
Another example, if we click on the blue half time home win “1” slice of the HT match result pie chart, we see that 33.48% of games were home wins at HT and of those, 78.59% of those teams went on to win their game (fair odds 1.27). This means you would need to have a very strong reason to bet against those teams winnings from that position.
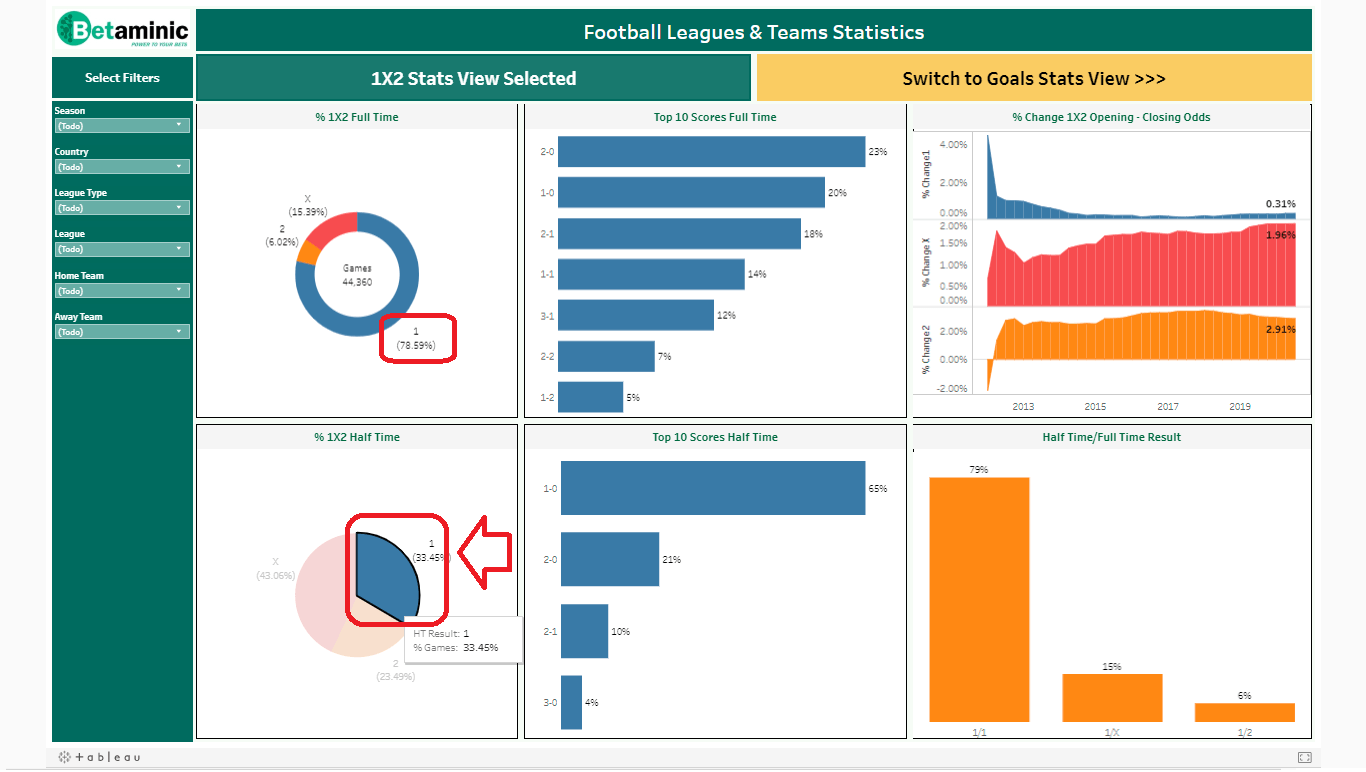
We can go deeper than that if we reset the chart and then click on the HT score 1-0, we can see that 72.75% of teams winning 1-0 at home at half time went on to win that game (fair odds 1.37). More interestingly, only 27% of those 1-0 at HT games finished 1-0 (fair odds 3.70), so there could be profit to be made backing another goal if the odds look good.
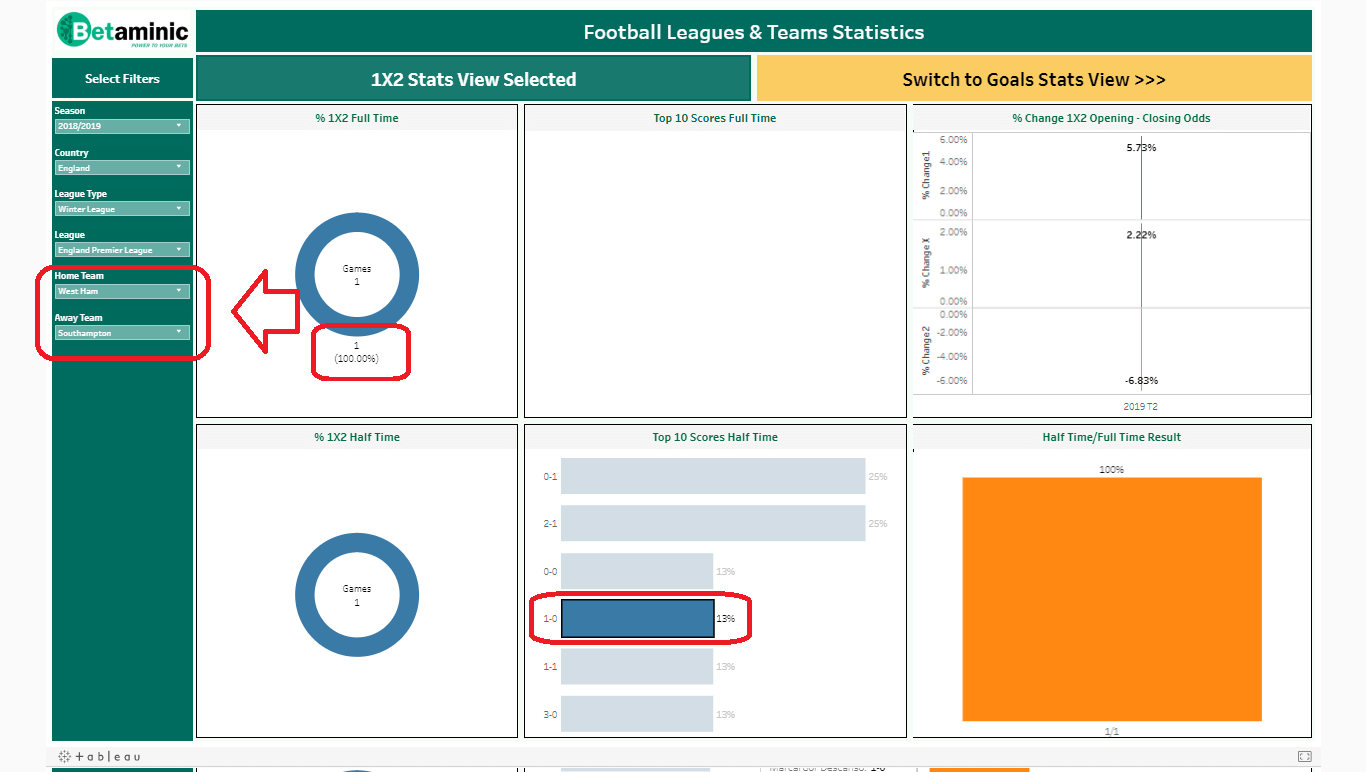
Team Statistics: Bet With More Confidence
We can be even more specific, if you are following a game live, then we can filter down to those specific leagues and then teams. If we are watching West Ham 1-0 up at home to Southampton, what kind of trends can we see?
In the Premier league 80.88% of home teams winning at half time go on to win that game. But in West Ham’s case they only go on to win 77.08% of games they are winning at half time (fair odds 1.3).
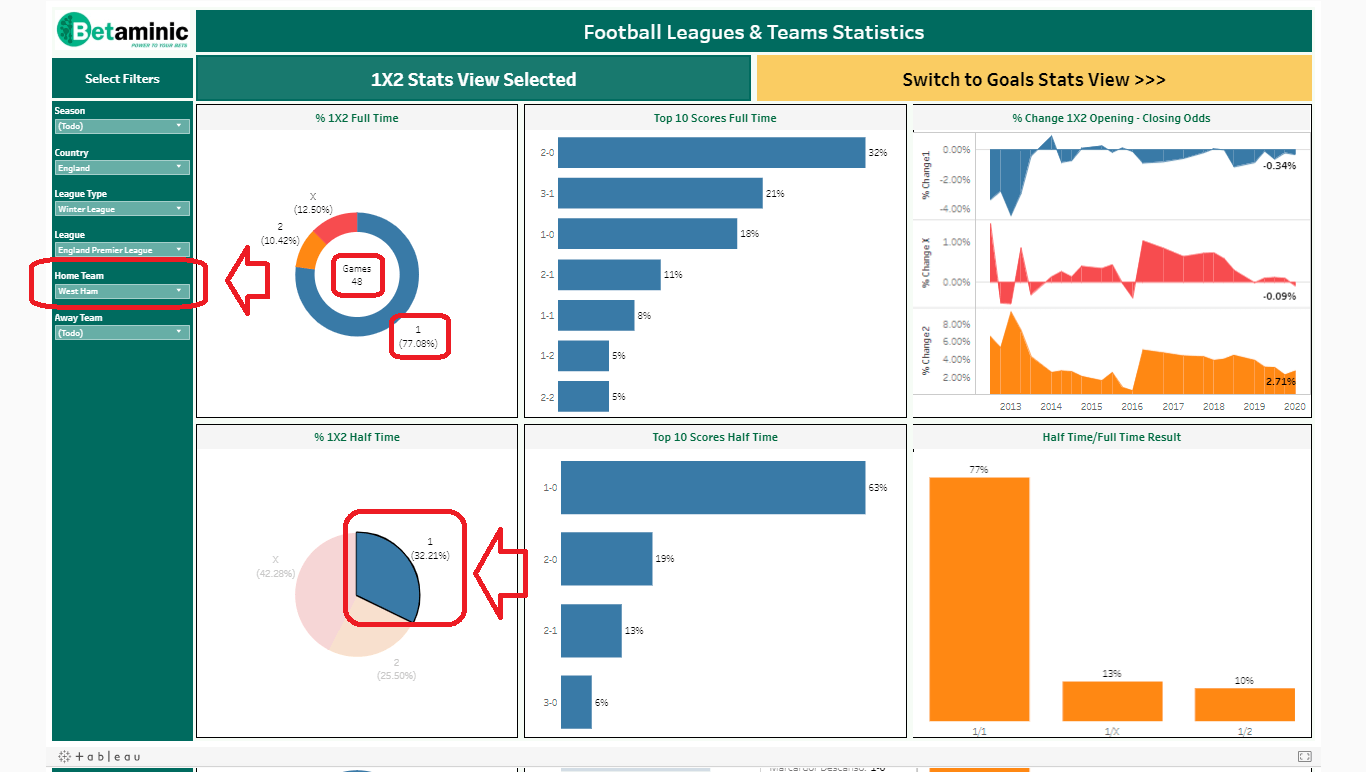
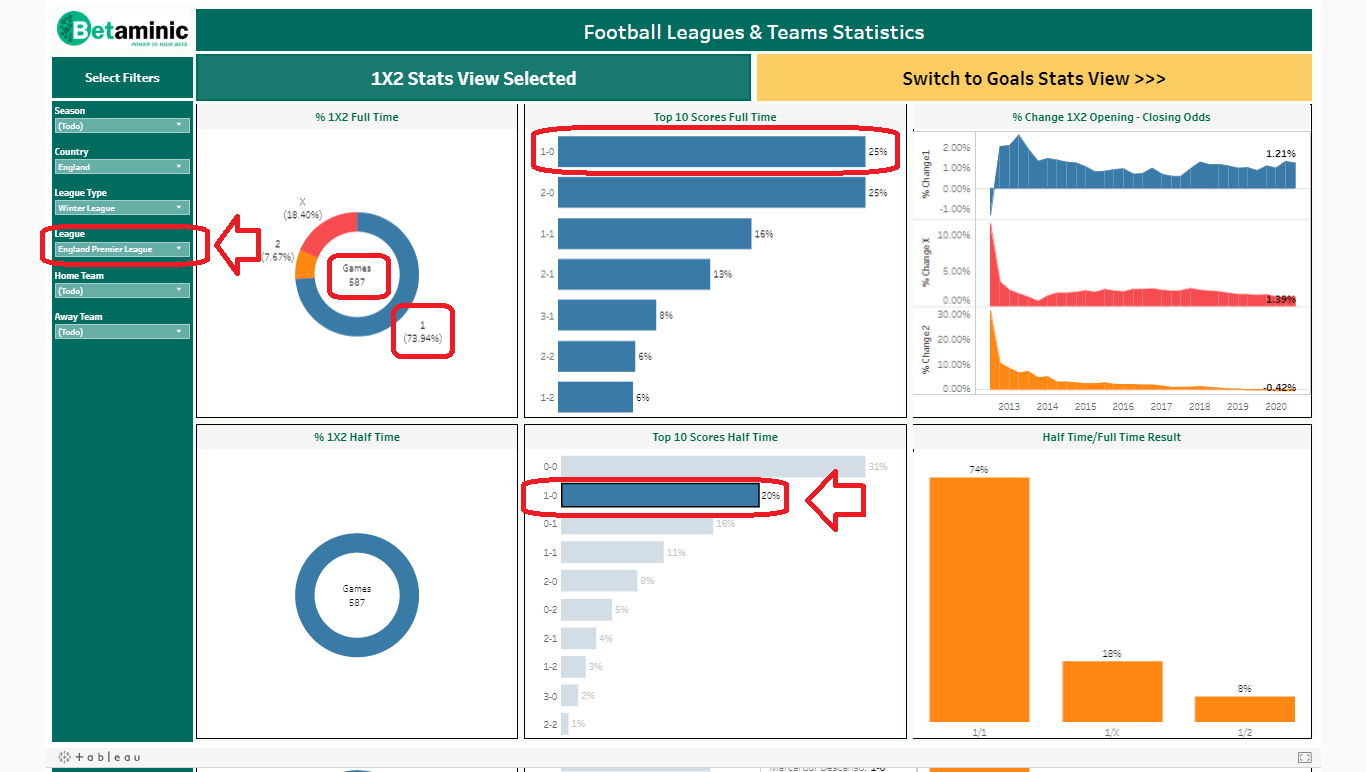
In the premier league 73.94% of teams 1-0 up at HT go on to win that game, and West Ham win 73.33% of games they are 1-0 up at HT in (fair odds 1.36).
Head to Head Statistics: Use Data to Make the Right Bets
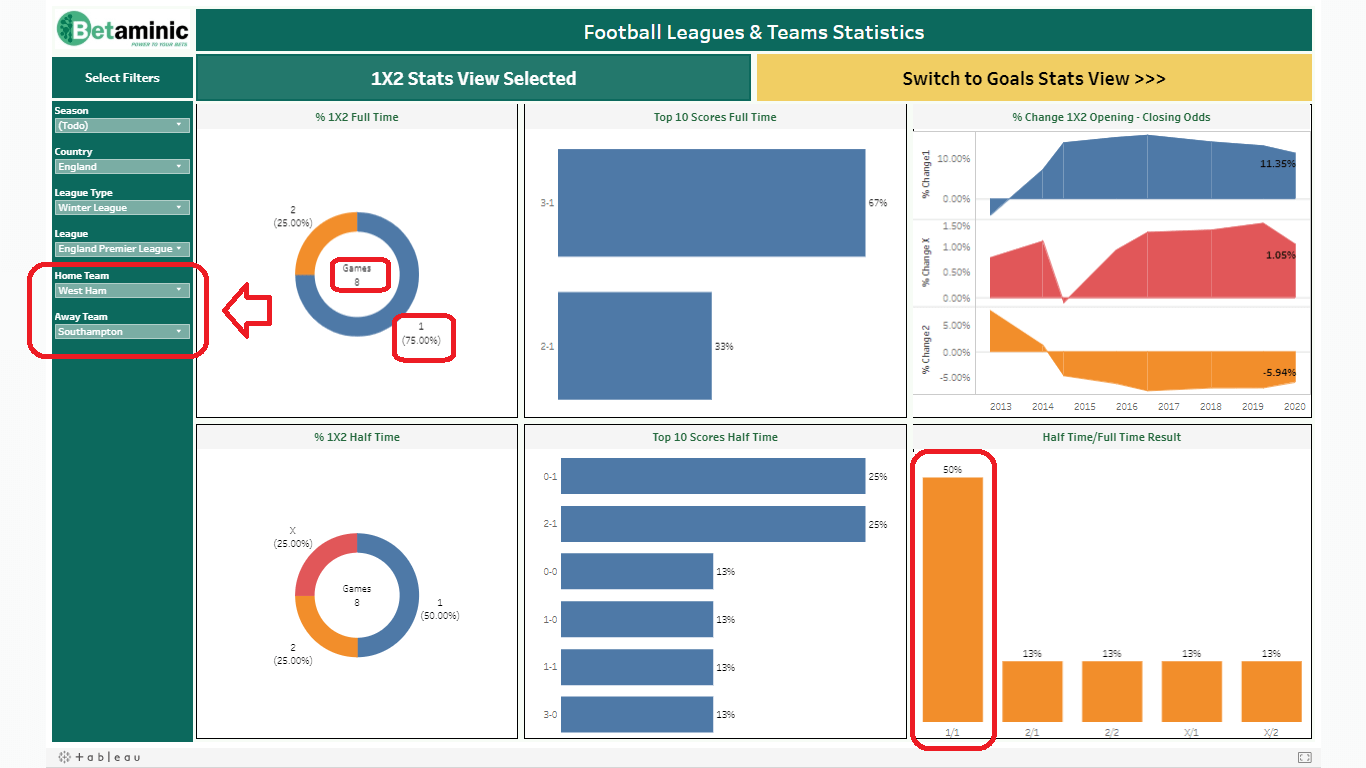
When playing Southampton at home, they have played 8 times and West Ham won 75% of those (6 of 8 games). In 4 of those 8 games they were winning at half time and West Ham went on to win all of those. West Ham have only been up 1-0 at half time once, and they went on to win that game. So now when we look at the odds of a game at HT, we can have a fair idea if the odds are value or not. If West Ham are winning at half time against Southampton, or a team of similar level, they may be worth a bet.
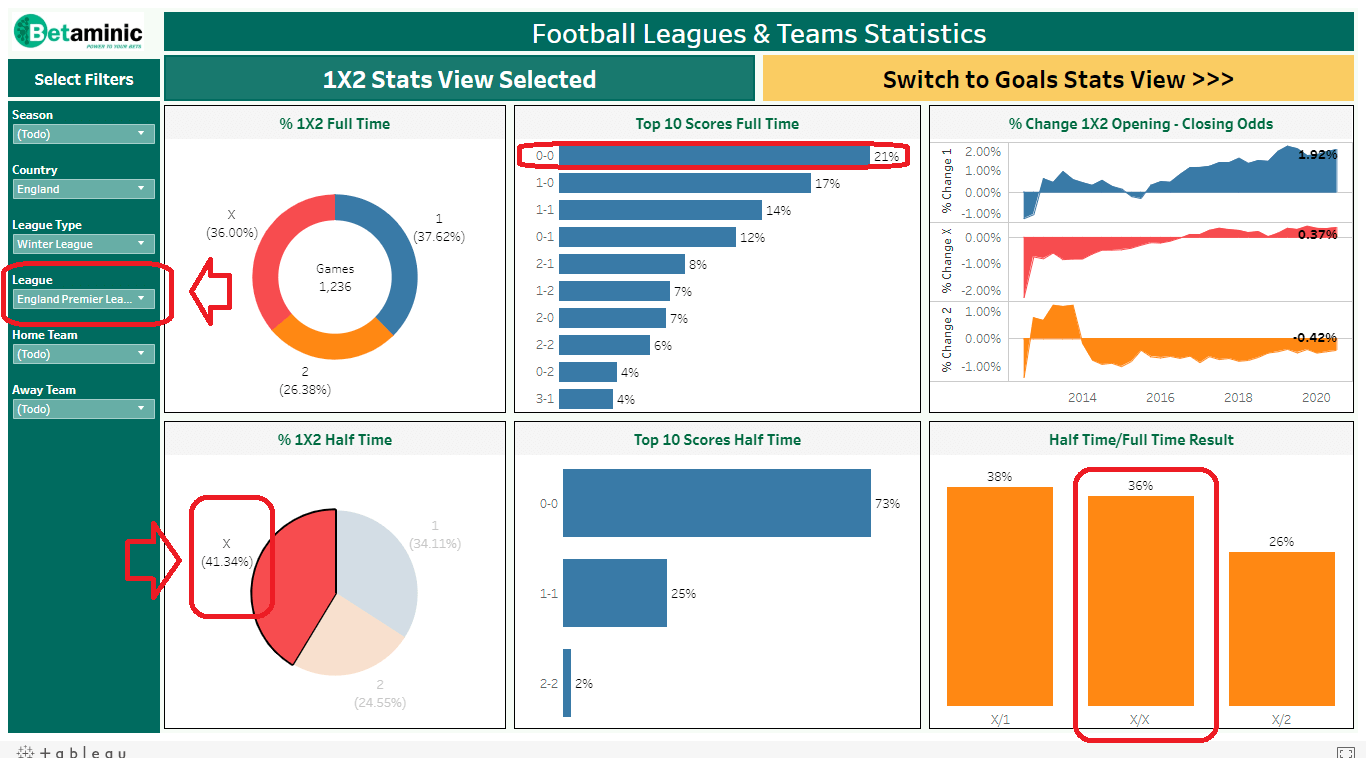
Half Time Draws: Lay the Draw or Bet on Another Goal
Another example is if we select the HT draw piece in Premier League games, we see that 36% of games went on to draw, but only 27% of those games that were 0-0 at HT finished as 0-0 (fair odds 3.7). So laying the draw or backing one more goal at HT may be profitable if the odds look good.
Dropping Odds: Know When to Bet Early or Late
One of the unique points of Betaminic’s statistic page is the ability to see trends of how the odds changed over time in a clear, visual format. We can look at general trends, country, league and team specific odds changes. We can also look at specific seasons, too. When using data driven betting strategies. We are trying to beat the bookmaker’s models. In general, bookmaker’s often start with lower odds than what is fair and then raise them as the market becomes more mature, with the best odds available closer to kick off.
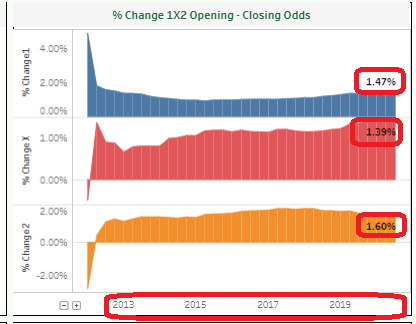
In the above graph we see that in general for all football leagues, the odds price tends to rise between 1.39%-1.60% from the time that they are first published until kick off. These odds are taken from asian bookies which is known to have one of the lowest bookmaker margins and have odds that are some of the best value available. This trend seems to continue from 2013 to the present. But it is better to look at leagues individually since bookmaker’s often change their models for each league.
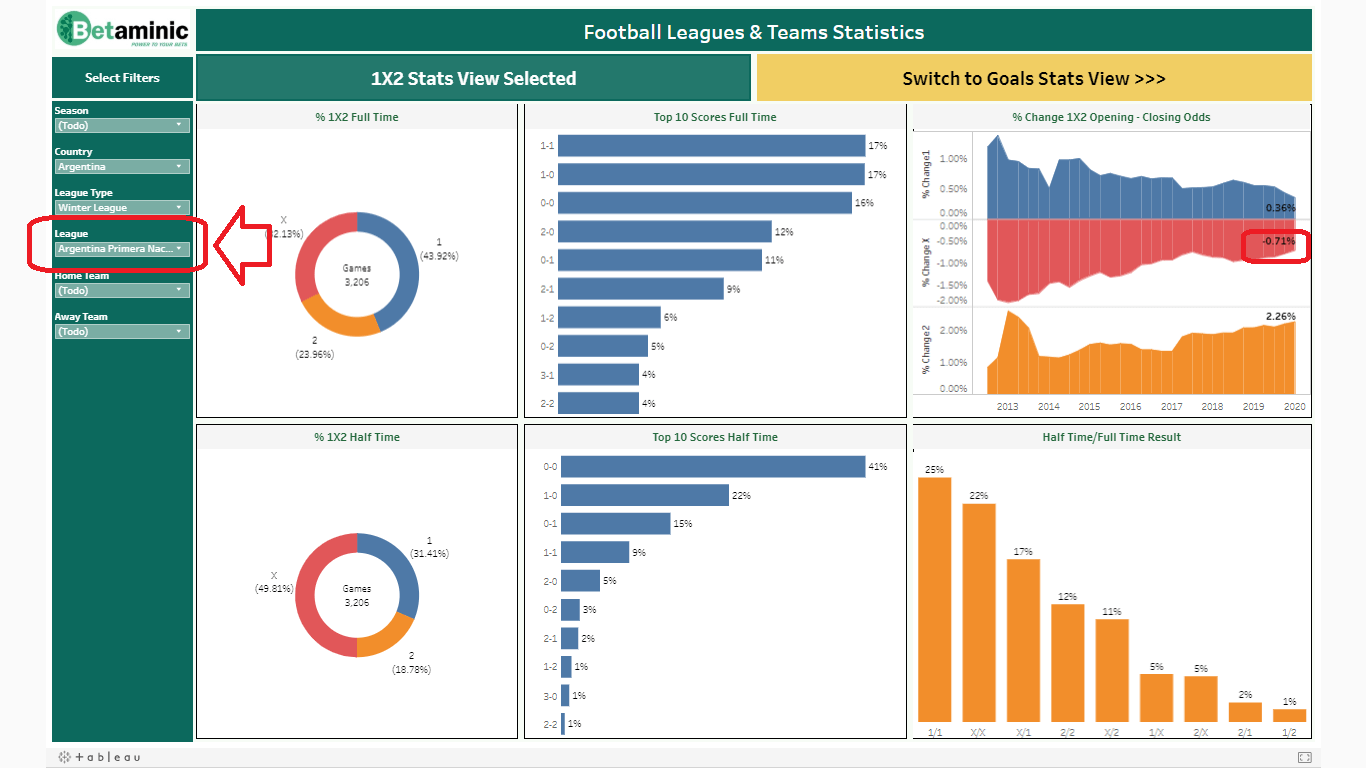
If we look at the Argentinian Primera Nacional, the 2nd tier league in that country. We can see that draw odds actually tend to decrease since they were published. This would suggest that their opening odds were too high, and often got lowered later on as people bet heavily on them or as the bookie adjusted to match the overall market price. Although we can see that this increase has been reducing over time since 2012. Note that the decreasing bars show that the average change is decreasing when the new data is added, it does not indicate the change for that year. In fact, we can filter and see just the most recent season’s data.
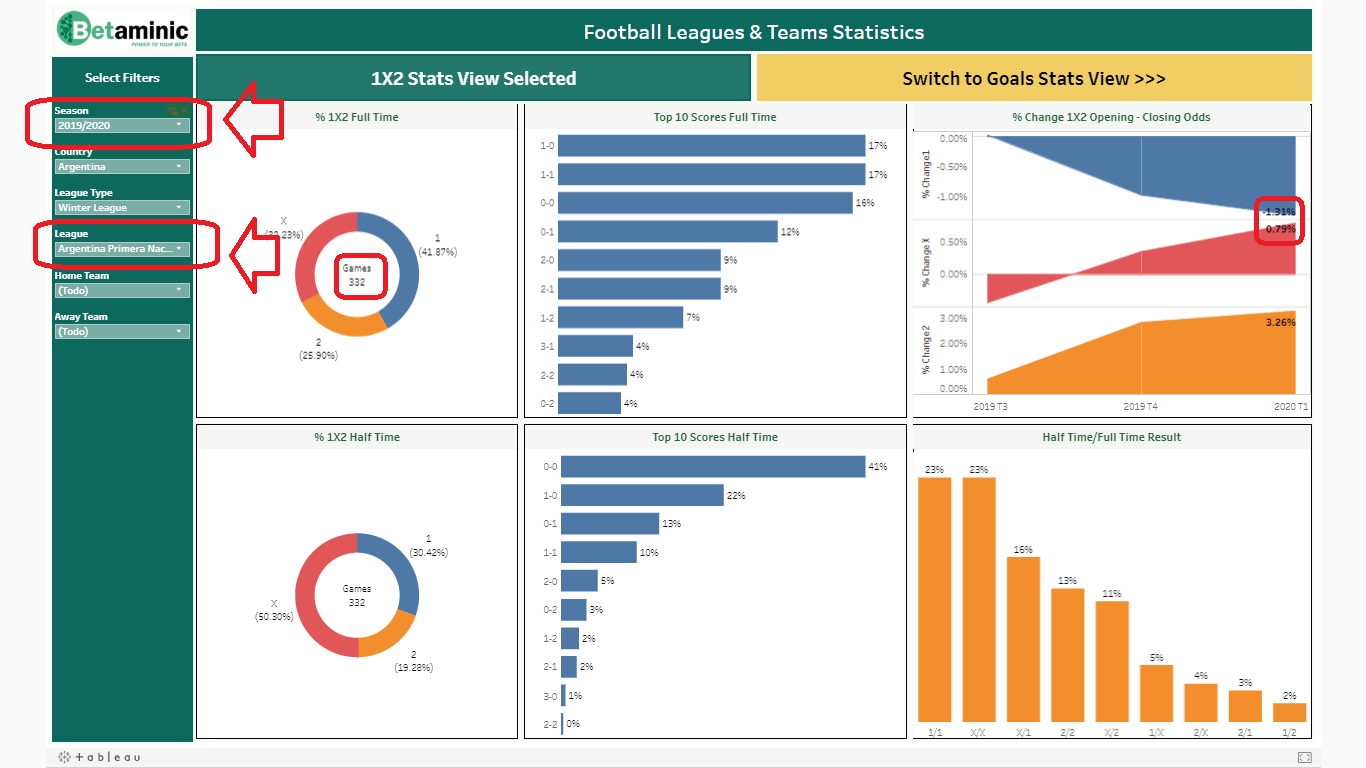
By selecting the 2019/20 season we can see there are 332 games in the data set and the dropping odds change has reversed. It seems the model makers have fixed their mistakes on the draw odds and now the odds tend to increase after they are published. However, it seems by fixing their draw odds, they have begun to misprice their home win odds, as the home win odds now show a trend of dropping odds after they are first published. This would suggest not only that it is better to bet early if you want to back a home team in the Argentinian Premier Nacional, but also that this league is a hard one for the bookmakers to make a good model for. So with further investigation in the Betamin Builder Tool, there may be chances for profit here. This shows the importance of not only checking each league, but also looking at the most recent trends in the data to see possible opportunities for a profitable strategy.
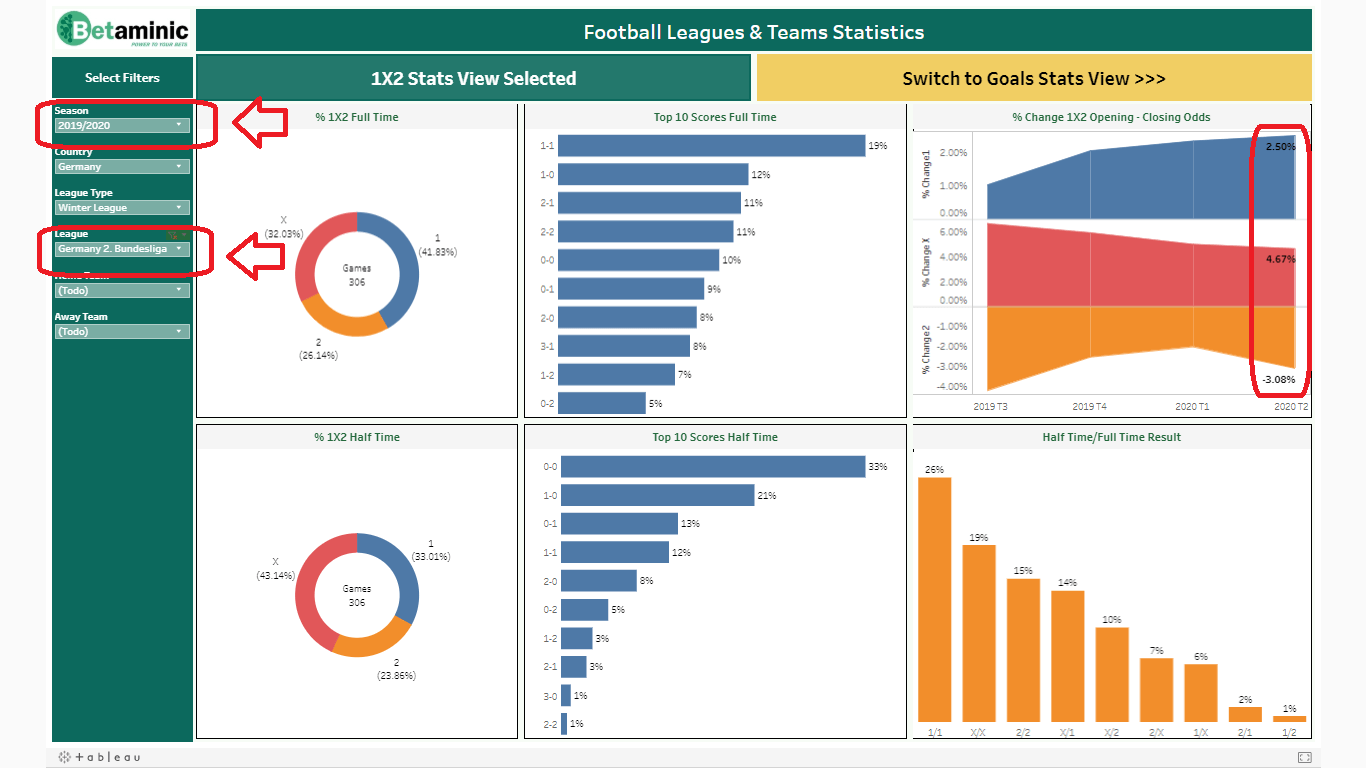
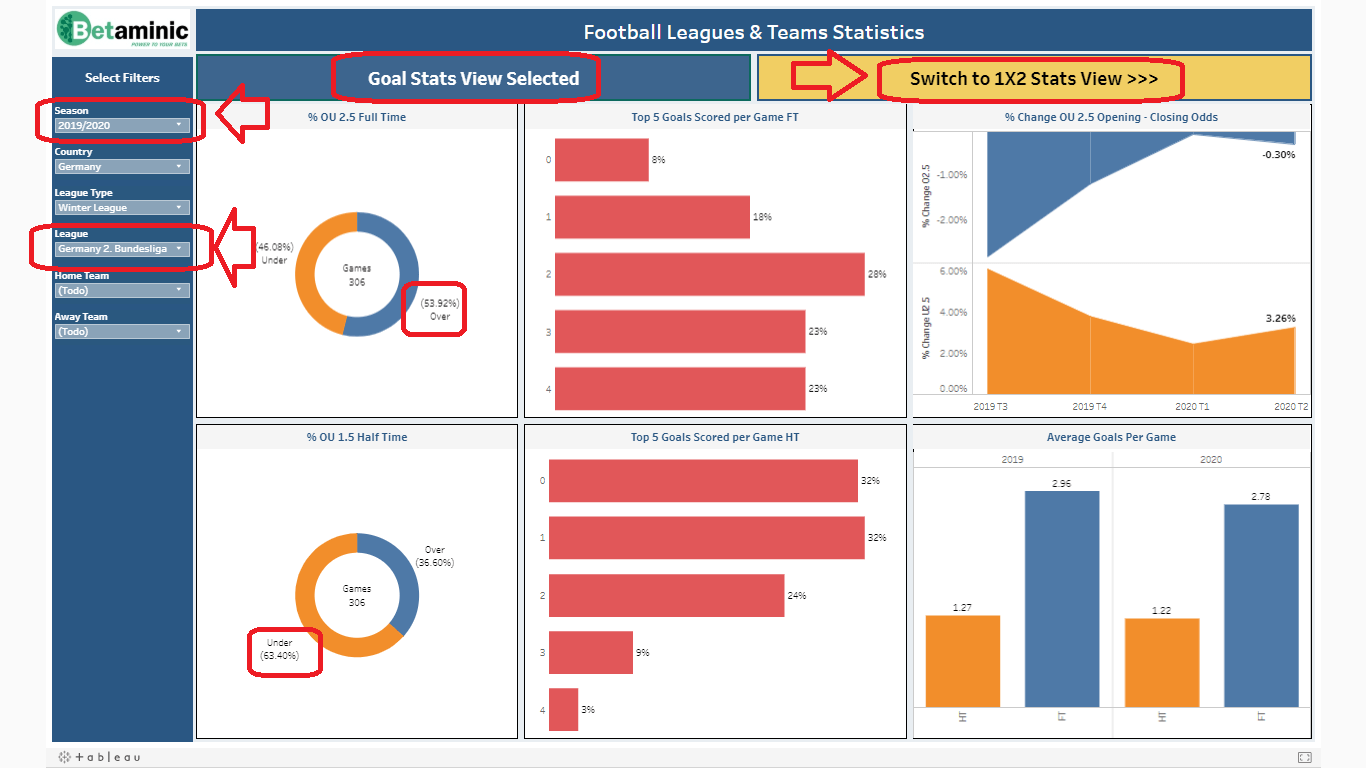
Most importantly, though, is that we can use these charts to know when to bet, early or late, opening odds or closing odds, depending on the type of bet and the league. For example, For the German Bundesliga 2, we can see that we should bet early on away wins (average odds decreasing trend) and late for home and draws (average odds increasing trend).
Total Goals Scored Statistics
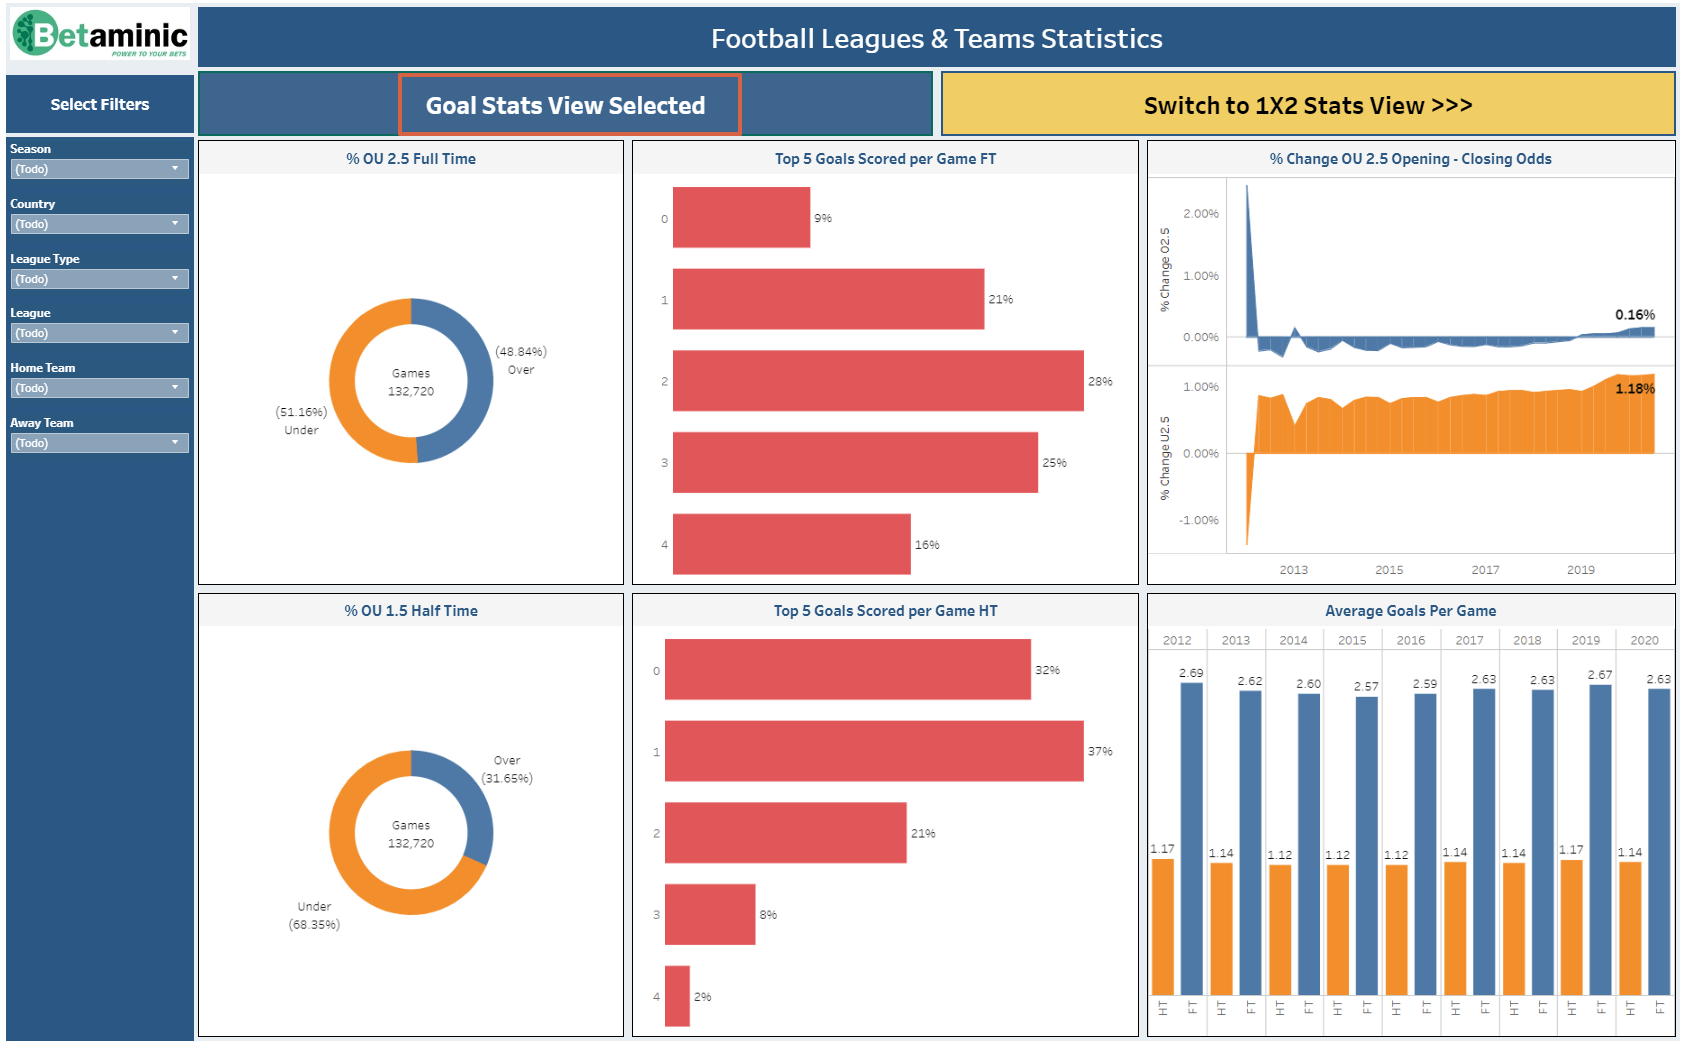
On the main screen, by clicking on the yellow “Switch to Goal Stats View” yet more soccer data becomes accessible. We can see data about the total goals scored at full time and half time. We can see the most common total goals statistics. We can see the average odds change from opening to closing odds of the over 2.5 goals market. We can see the average goals scored at HT and FT

League Specific Goals Data: Find Trends for Smart Betting
Again we can use the interactive charts to filter down to specific leagues and look for patterns. For example, in the German Bundesliga 2 we see that its over 2.5 goals at FT percentage for this season (53.92%) is higher than the overall football trend for all leagues (48.83%). And then we can also see that the German Bundesliga 2’s under 1.5 goals at HT percentage for this season is 63.40%. This trend suggests that waiting until half time to enter the over 2.5 goals bet in this league might be a profitable strategy. It seems that there are likely to be less than 2 goals having been scored in the first half, but still a higher chance than other leagues of the game finishing with 3 goals or more.
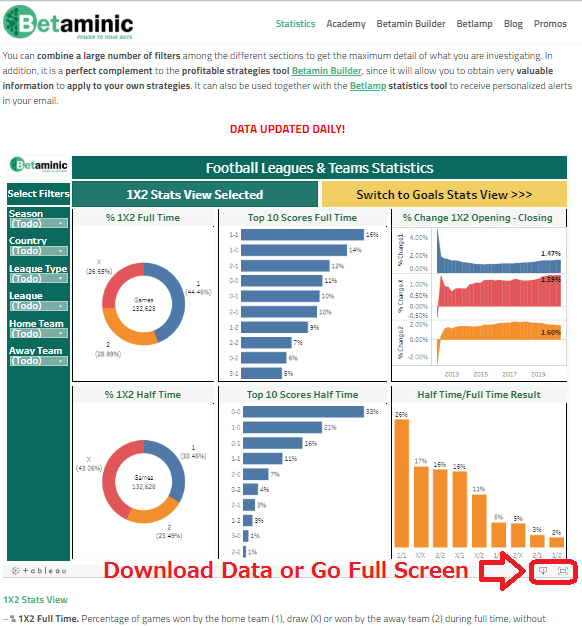
Quick Tips: Go Full-Screen or Download the Data Easily
You can make the chart go full screen by clicking on the box in the bottom right of the tool. This can make it easier to view. You can also save the data currently displayed by clicking on the box with a down arrow that is next to the full screen button. Data can be saved an image, a PDF or even in PowerPoint format.
Power to Your Bets with Betaminic
Betaminic is a website that has a vast amount of football data from over 50 major leagues around the world since 2012. Betaminic has a range of useful tools at the bettor’s disposal to analyse historical football data and real bookmaker odds.
Betaminic’s Statistics Pages have interactive charts and tables with daily updated football statistics including 1X2 markets, goal markets, odds change data, total goals HT/FT, HT/FT result and so on that can be manipulated in a wide variety of ways to see countries, leagues, teams and seasons in an easily accessible way.
Using this data Betaminic has also produced two other unique big data analysis tools, the Betamin Builder and Betlamp.
The Betamin Builder tool combines the football data with real bookmaker historical odds data so that it is possible to backtest strategies and find out what betting systems work or not. It allows us to find patterns and trends in the data, to find consistent mistakes in the bookmakers odds calculation models, and to take advantage of those for profit. It uses the most common betting markets (1X2, OU 2.5 goals, Double Chance and DNB). You can have future picks from that strategy emailed to you.
The Betlamp tool has many kinds of football statistics available in it, with a wide variety of markets to choose from: 1X2 (HT & FT), Over/Under 0.5, 1.5, 2.5, 3.5 goals at HT or FT, Asian Handicap, Total Goals HT or FT, Over/Under from 8.5 to 13.5 Corners, Both Teams to Score (HT &F T), Yellow Cards and more. It is an excellent tool to detect trends. You can view statistics of all the matches in the season or the last 2, 4 and 8 games played. You can display the results of the games played at home/away or overall. You can have future fixtures that match your selection criteria emailed to you for free.
Analysing football statistics is made easier and more accessible with Betaminic. Use our tools to find trends and create profitable strategies for football betting.
Sign Up for free to access the Betamin Builder here.
Read more about Betaminic’s soccer statistics pages here.
Access Betlamp, the amazing free statistics tool here.
See the best betting systems ranked by profit, ROI and risk here.