How to select profitable teams for your betting strategies

Don’t you know how to select the most profitable teams to create your own betting strategies? Do not miss this article where you will discover all the necessary steps to choose those teams that will make you build a long-term winning strategy.
The best betting strategy on Betaminic.com right now is “OVER” which has made 750 points since it started and over 52 points profit in the 6 months since it was shared publicly in September 2019. This strategy recommends bets in the over 2.5 goals market. A very interesting thing many people notice about this strategy is that not only are specific leagues selected by this strategy, but also specific team names. How did this user select those team names? Betlamp, a 100% free football data tool from Betaminic, is the place where we can get team specific data in an easy to understand way.
Betaminic is a website that has a vast amount of football data from over 50 major leagues around the world since 2012. Using this data Betaminic has produced two unique big data analysis tools, the Betamin Builder and Betlamp.
The Betamin Builder tool combines the football data with real bookmaker historical odds data so that it is possible to backtest strategies and find out what betting systems work or not. It allows us to find patterns and trends in the data, to find consistent mistakes in the bookmakers odds calculation models, and to take advantage of those for profit. It uses the most common betting markets (1X2, OU 2.5 goals, Double Chance and DNB). You can have future picks from that strategy emailed to you.
The Betlamp tool has many kinds of football statistics available in it, with a wide variety of markets to choose from: 1X2 (HT & FT), Over/Under 0.5, 1.5, 2.5, 3.5 goals at HT or FT, Asian Handicap, Total Goals HT or FT, Over/Under from 8.5 to 13.5 Corners, Both Teams to Score (HT &F T), Yellow Cards and more. It is an excellent tool to detect trends. You can view statistics of all the matches in the season or the last 2, 4 and 8 games played. You can display the results of the games played at home/away or overall. You can have future fixtures that match your selection criteria emailed to you for free.
Betlamp Charts: Average Goals Per Game
We can use the charts and tables from the Betlamp tool to find which teams score many goals and then put those team names into Betamin Builder strategies for the Over/Under 2.5 goal markets. The charts are updated daily and are free to access and manipulate.

Figure 1. To access the goals charts, go to www.betaminic.com and select the “Betlamp” dropdown menu. Then select “Charts” and then “Goals”.
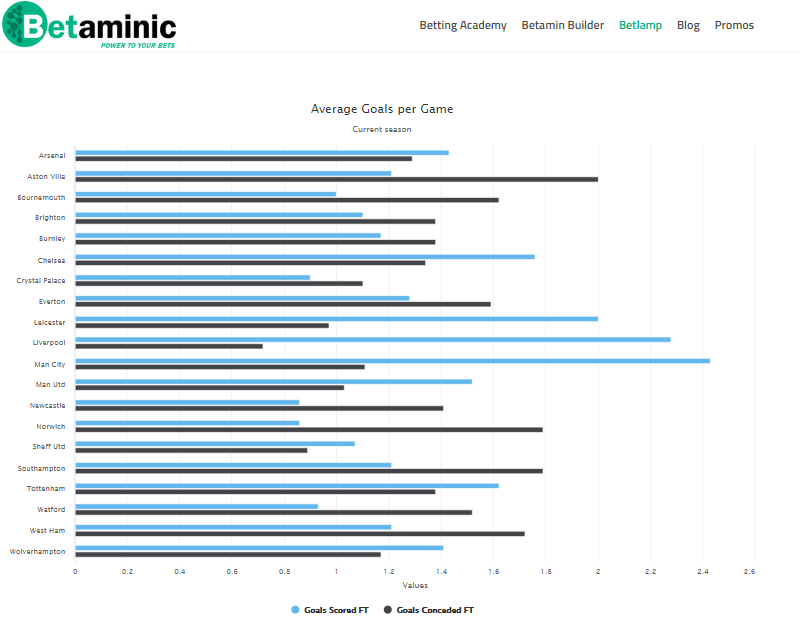
Figure 2. The “Average Goals per Game” chart.
On this page, we can select one of the 54 leagues of data offered and then see very easily which teams score and concede the most.
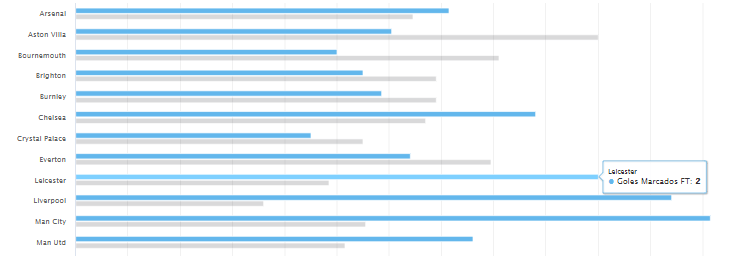
Figure 3. Hover over the chart for more specific data.
If we hover our mouse over a bar, we will get the actual number displayed. Here we see Leicester has scored an average of 2 goals per game by FT.
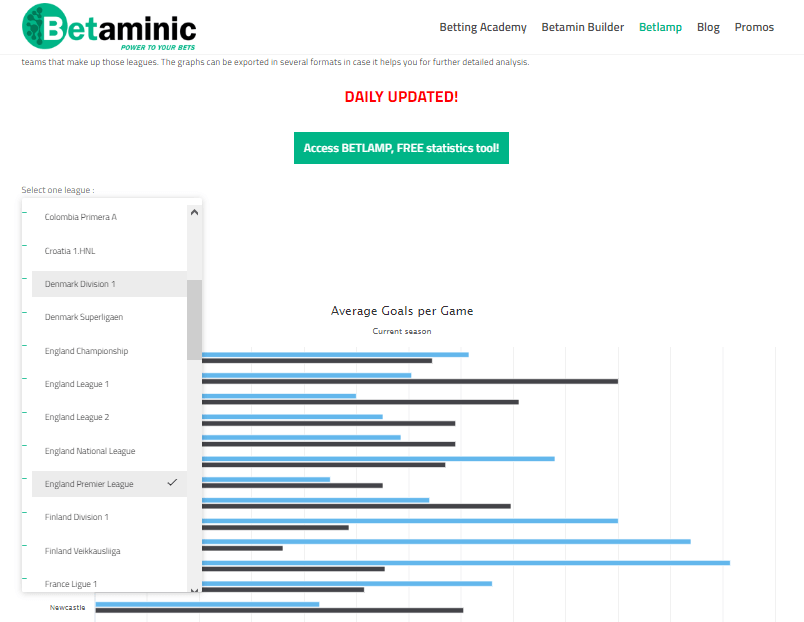
Figure 3. Select other leagues from the drop down menu at the top left of the chart.
There are statistics for 54 leagues available. We can view each one by selecting the league from the drop down menu at the top left of the chart. The data is for the current season. With this data, we can take the names of the highest scoring teams and put them into a new strategy on the Betamin Builder and see if over the long term following these teams would have made profit. If it did, then we have a new over 2.5 goals strategy that has potential for future profit. We could also do the same for the opposite. We could take the names of the teams scoring the least goals and see if putting them into an “under 2.5 goals” strategy or even a “draw” strategy that might produce profit. The point is that we can pick up teams with a positive, goal scoring mentality and style of play, and use them in goal focused strategy creation. If we already have a strategy that has been filtered down to specific leagues, then we can further refine that filtering, by following the goal scoring teams and dropping the goal shy ones.
Betlamp Tables: % of Games Over 2.5 Goals

Figure 4. View sortable tables of data of all teams together
There is another way, to view and sort the data. It is possible to see all teams from all leagues in one table and then to rank them in order of the statistic that you are most interested in. Again, click on the Betlamp dropdown menu, then select “Tables” and “Goals stats FT”.
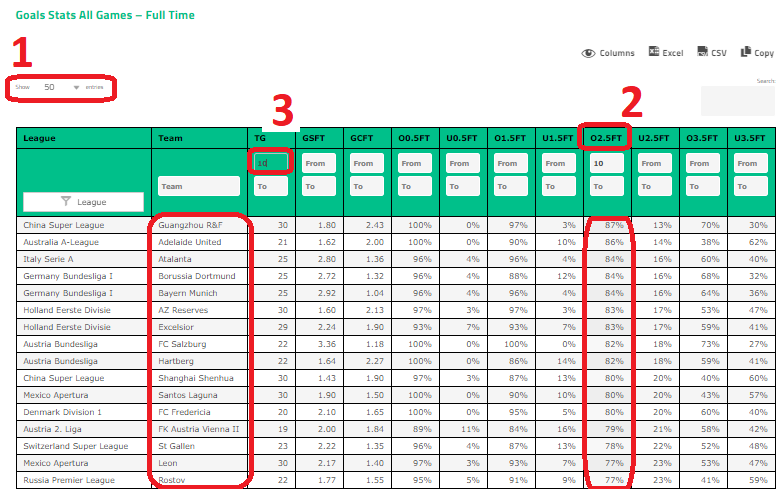
Figure 5. Teams sorted by percentage of games that finished with over 2.5 goals (3 goals or more in a game).
First, you can select how many teams you want to have shown on each page. Second, you can click on the “O2.5FT” column header to sort the table by percentage of games that finished over 2.5 goals. Thirdly, I recommend adding a filter into the “TG” column (Total Games) of “10” so that we don’t see teams with 100% records from just a few games played. If we put “10” into the “from” cell, then it only includes teams which have played 10 or more games so far this season. From this table, we now see that Guangzhou R&F, Adelaide United and Atalanta are all teams that are often being involved in over 2.5 goals games. So I can take those 3 team names and put them into the Betamin Builder, which has the historical bookmaker odds, and see if backing them over the long term generates positive results.
Betamin Builder: Adding Team Names
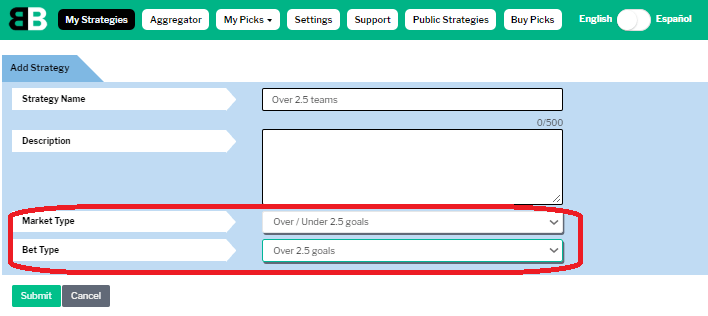
Figure 5.1 Creating a new strategy
In the Betamin Builder tool I “add a strategy” and select the “Over / under 2,5 goals” market and select the Bet Type as “Over 2.5 goals”.
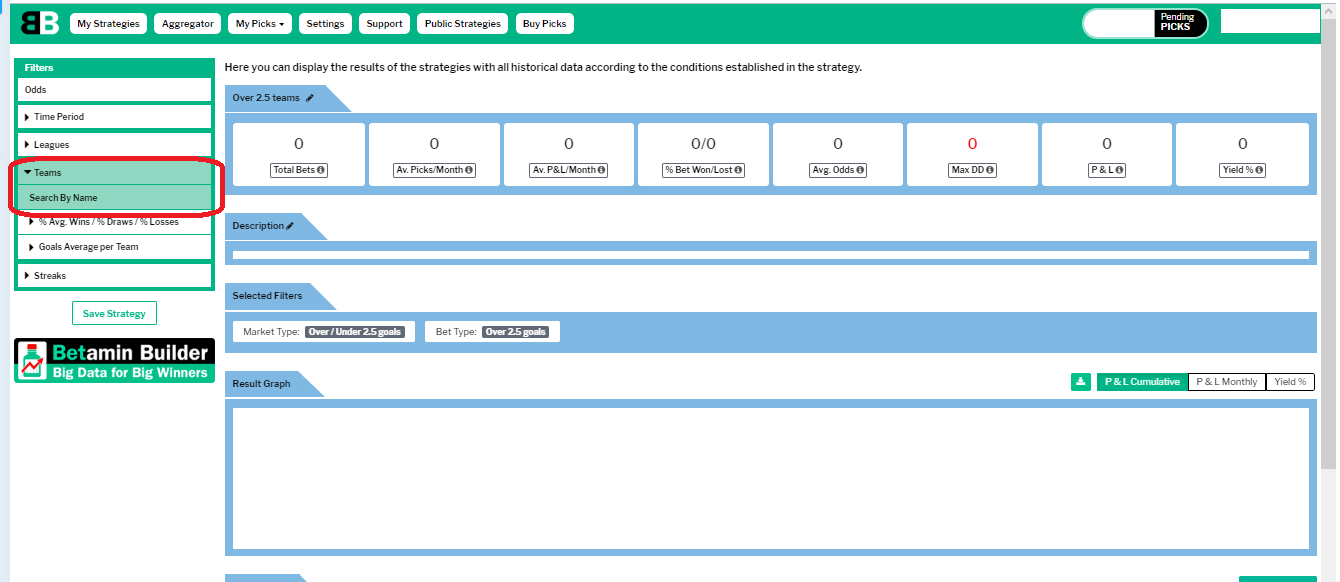
Figure 5.2 Adding team names
From the drop down menu on the left I select “Teams” and then “Search By Name”.
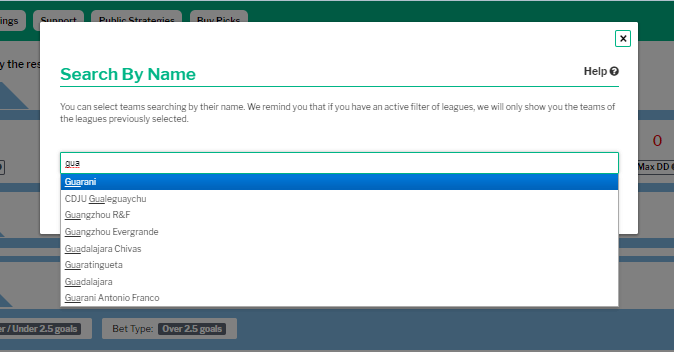
Figure 5.3 Enter part of the team name to quickly find teams
Just by entering the first few letters of a team name, it will quickly show use teams beginning with those letters. This smart searching makes it quick and easy to find the teams.
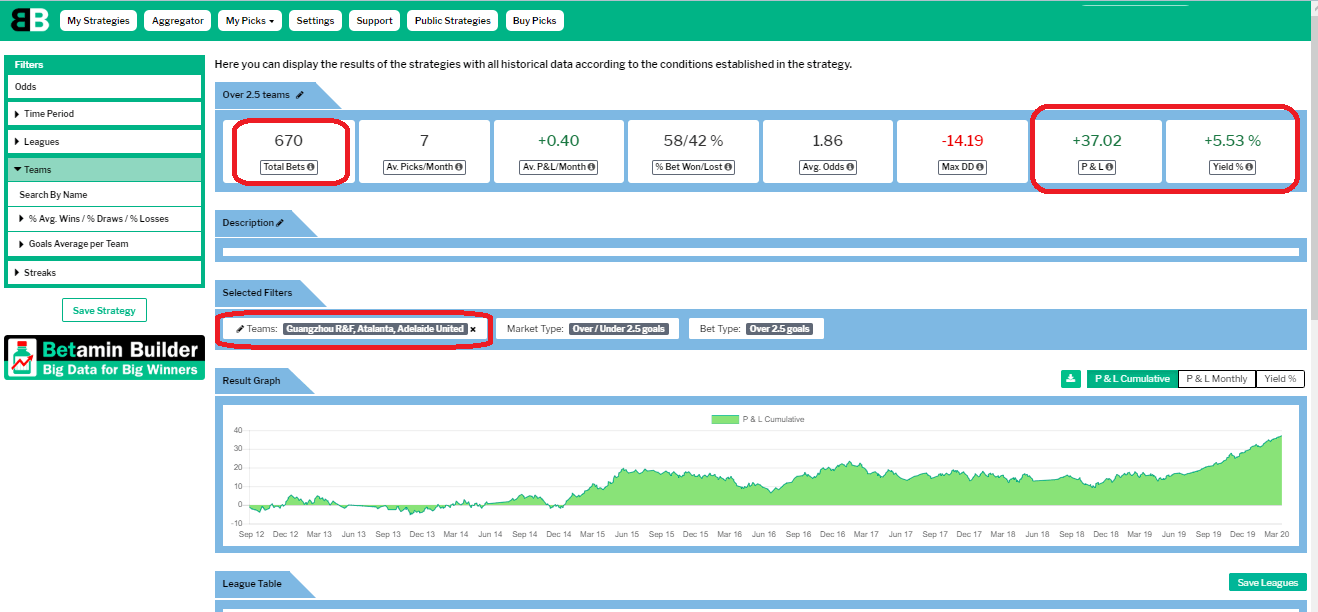
Figure 5.4 Betamin Builder strategy results
After saving the team names, we can see that whilst the data that highlighted these teams was only from the current season, it has found a long term trend that shows a 5.53% yield over 670 matches in the past 8 years. With the right staking plan, this 37 points of profit could be multiplied into even bigger profits.
Betlamp Tables: Average Goals Scored Per Match
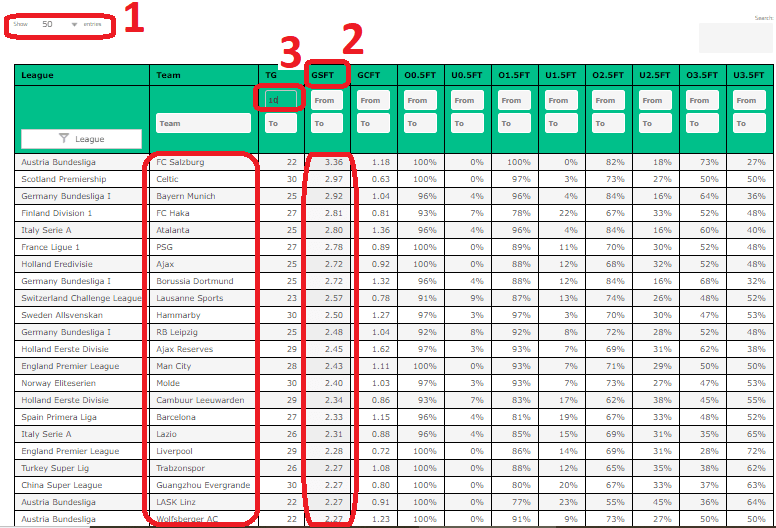
Figure 6. Rank by Goals Scored
We can rank the teams by the other columns, too. As we are trying to find teams that score many goals, then we can sort the table by “GSFT” (Goals Scored Full Time). This column will rank the teams by average goals scored in 90 minutes. The teams that scored the most goals will get shown at the top. We see that FC Salzburg, Celtic and Bayern Munich are the top 3 an we can add these teams into our Betamin Builder strategy.
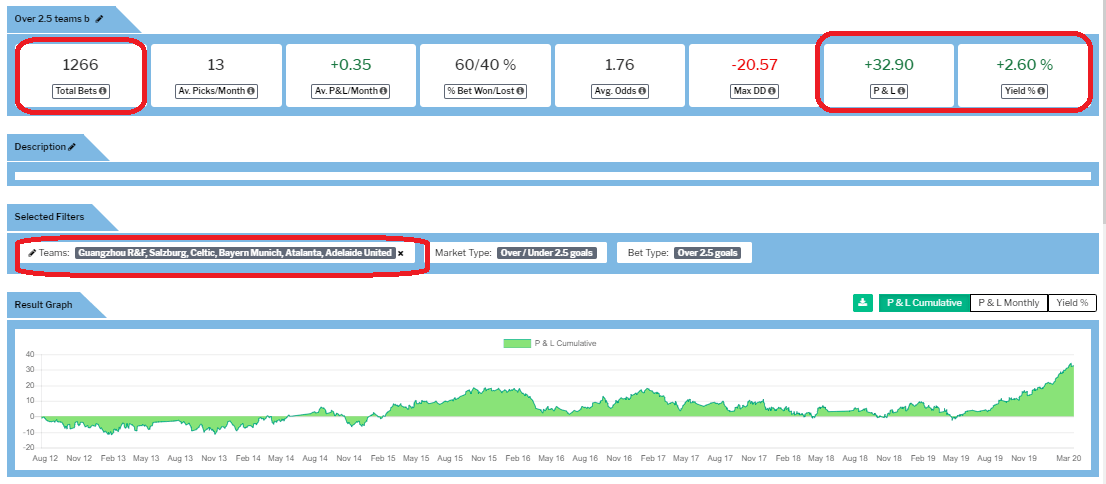
Figure 6.1 Updated strategy results adding that FC Salzburg, Celtic and Bayern Munich.
Interestingly, here the profits are not improved and the yield actually goes down to 2.6%. Why is this? This is because we have found a key statistic that the bookmakers obviously use to make the odds models. So teams with higher goal scoring averages may get deliberately reduced odds that make them unprofitable over time. Another factor is that Bayern and Celtic are both big teams that often run up cricket scores against other teams and there will be a lot of market pressure on their over 2,5 goal bets anyway. So we also need to use our head when picking teams.
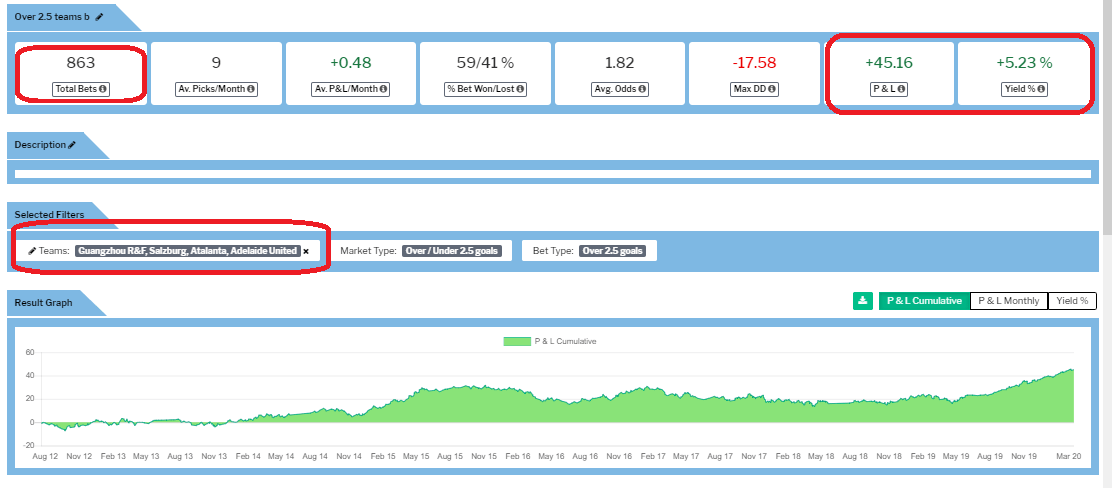
Figure 6.1. Keep FC Salzburg but Celtic and Bayern removed from the strategy.
If we remove those two big names from the strategy we see the profit goes up to 45 points from the original 37.
Betlamp Tables: Average Corners Per Match

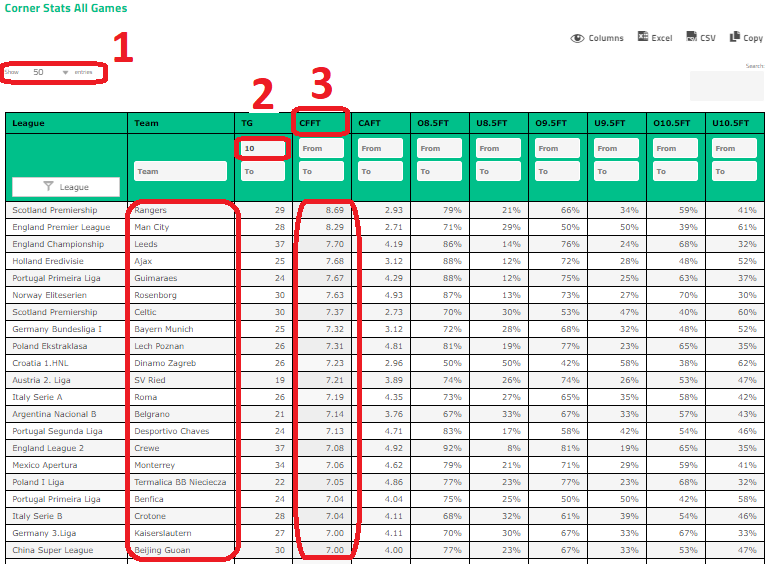
Figure 7. Total Corners Table
One key point that we have found here is that we are looking for statistics that can highlight a profitable pattern that beats the bookmaker models. This means using other statistics such as corners might identify teams that are likely to be involved in games that have goals. From the Betlamp drop down menu, we can select “Tables” and “Corner Stats”. Then we can rank by the “CFFT” column (Corners For Full Time) and this will rank the teams by those who go the most average corners for their team. “CAFT” mean Corners Against Full Time and those corners which the team conceded. Attacking teams that create a lot of chances are more likely to have more “Corners For” in games. Here we can see Rangers, Man City, Leeds, Ajax and Guimaraes are at the top of this table.
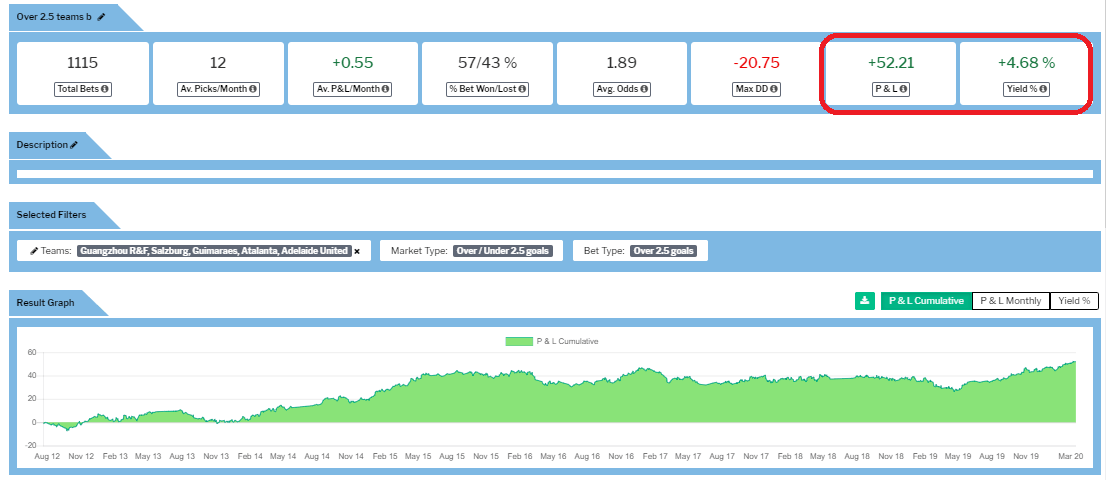
Figure 7.1 Adding Guimaraes into the strategy.
Checking each of these teams in the Betamin Builder reveals that Guimaraes over 2.5 goals odds have been mispriced in the long term by bookmakers and profit can be made from following their games and adding this team into our developing strategy.
The “OVER” strategy
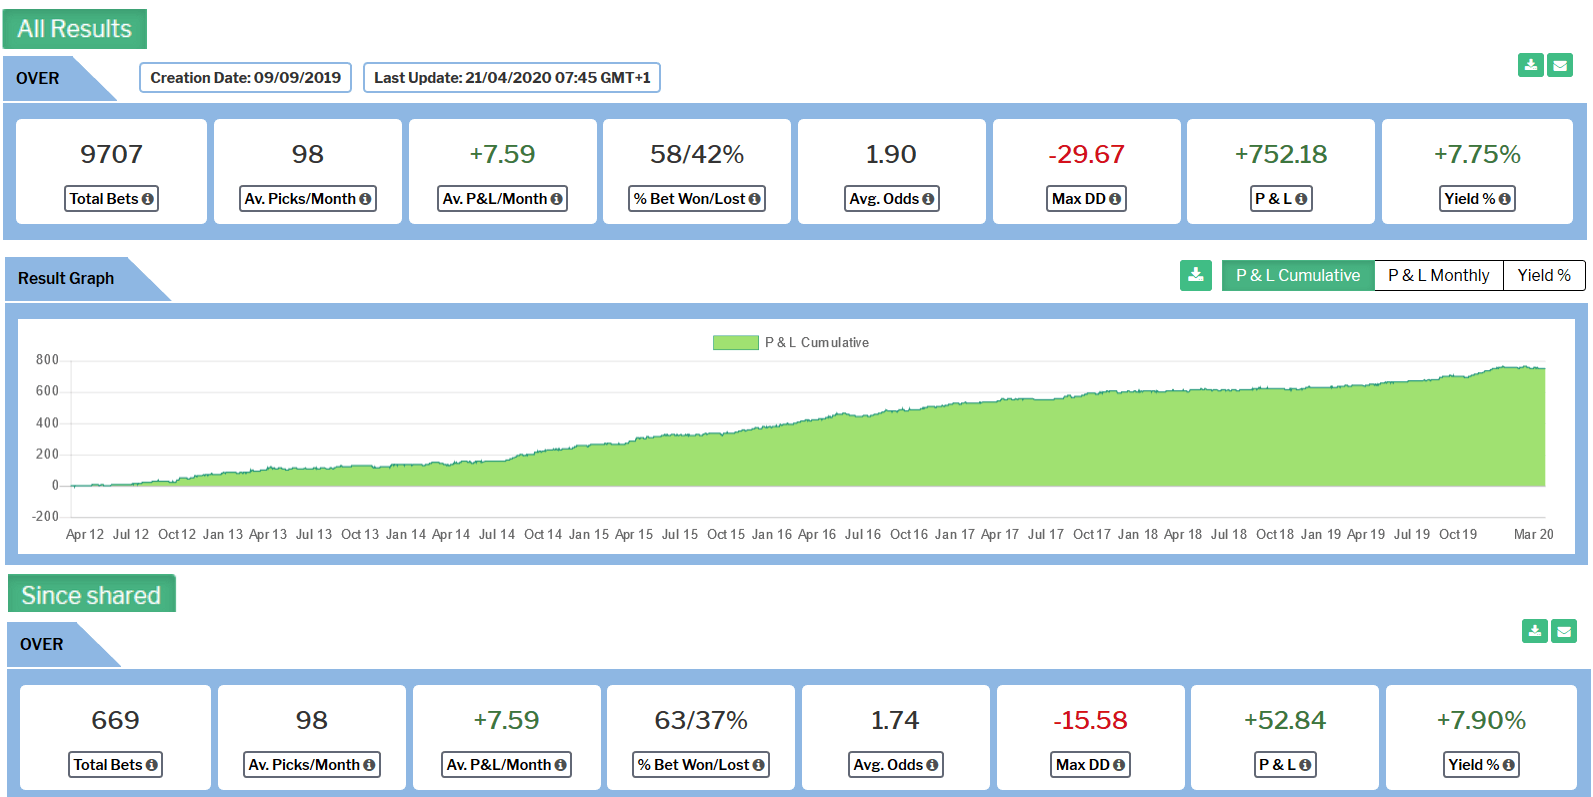
Figure 8. The OVER strategy on Betaminic.com
The “OVER” strategy with an amazing 7.75% yield, which is already publicly shared on the Betamin Builder tool, is a great example of how we can use the statistics from Betlamp to find specific team names and use them in profit making betting strategies with the Betamin Builder. This strategy is showing that it not only has excellent results with backtesting, but since it was shared with the rest of users, improving the figures, with a yield of 7.90% with 669 picks sent.
Two Great Football Data Analysis Tools: Use Now For Free
Betaminic offers free access to all this football data and makes it easier to analyse and find trends in the statistics. By using the data from Betlamp and the Betamin Builder, it is possible to find profitable betting strategies that beat the bookmakers.
Sign Up for free to access the Betamin Builder here.
Access Betlamp, the amazing free statistics tool here.
See more Betaminic Books here including a free eBook.
See the best betting systems ranked by profit, ROI and risk here.