Betting System Backing the Draw / Apostando al Empate (107 of 111 leagues) (Updated 2021-12-09)

The draw bet is often overlooked by the casual bettor since, along with betting on under 2.5 goals, it is not a “fun” bet to follow. Home wins, favourites, banker bets and betting on goals are the popular choices. But skipping this market means missing out on value bets. In this article, we show how Betaminic has found a strategy for the draw market that has made profit every season for the past 10 seasons. Do you want to know how to find value in the draw market? Read on.
What is Betaminic?
Betaminic is a website that has a free online tool called the Betamin Builder for analysing soccer statistics and historical bookmaker odds. By analysing the past data of over 200,000 matches, winning patterns can be found. For example, there are many leagues where backing the draw in certain conditions leads to profit long term. Betaminic’s tool, the Betamin Builder, allows you to find those value patterns. There is also a way to have future picks from those profitable trends emailed to you so that you can bet on them. Basically, if you can find what betting system would have made profit in the past, it gives you a promising strategy to follow in the future. You can sign up for free here and see for yourself.
Summary of the Strategy Results:
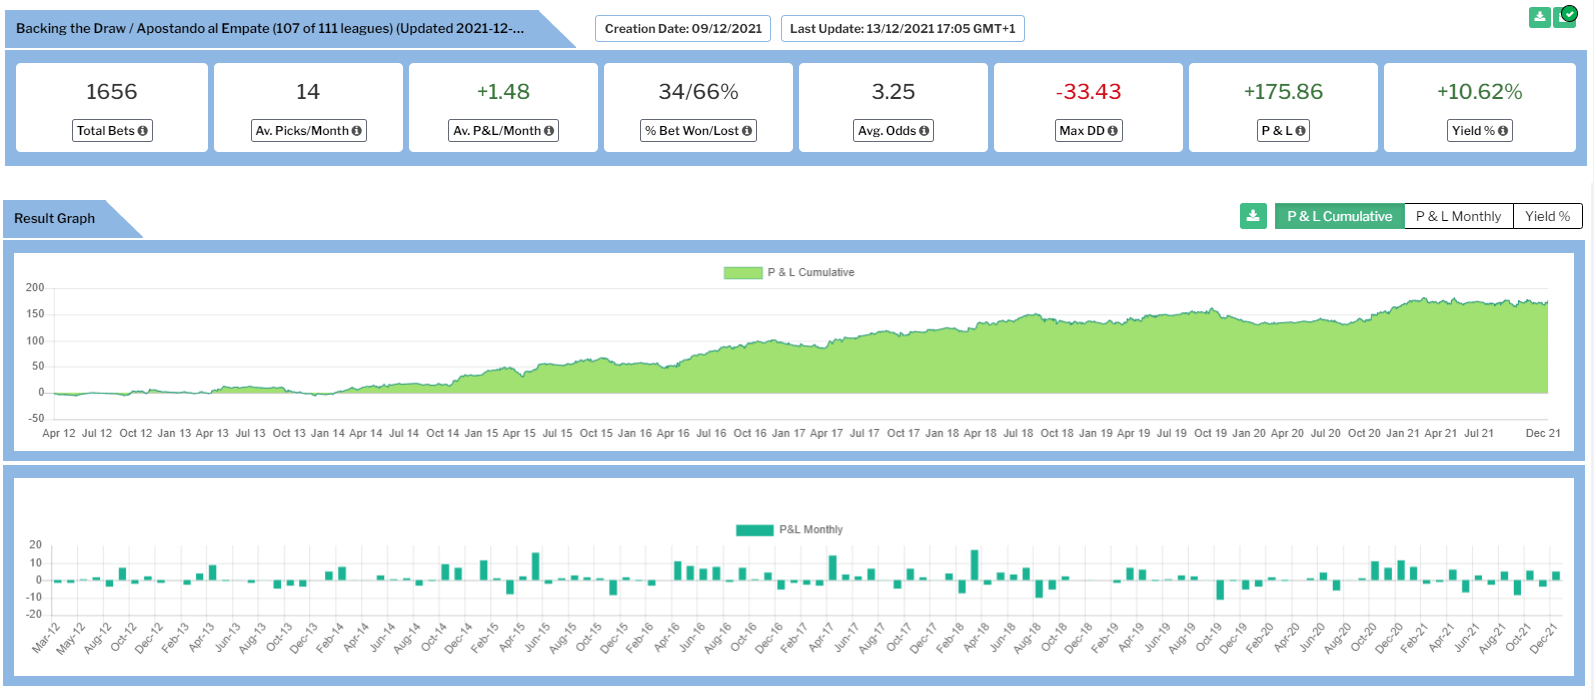
These are the results obtained after analysing the strategy “Backing the Draw / Apostando al Empate (107 of 111 leagues) (Updated 2021-12-09)” using historical data between April 2012 to December 2021.
Start now -> You can follow this strategy easily by using this simple guide.
Understanding the draw market odds and beating the bookmaker margin
Bookmaker draw odds are sometimes above value in response to the public favourites or short term form.
For example, in the case of the public favourites, even if the bookmaker has their own idea of the fair odds and their standard bookmaker margin that they take off them, if they also think the public will overly back the home team based on their famous name or recent good form, then the bookmaker will probably lower those odds a bit more to reduce their liability as they know most of the money coming in will be for the home win. They then put up the draw and away win odds to try and encourage users to also bet on those outcomes and help them balance their books. Of course, it is not really as simple as this, but the bookmakers do reduce odds lower than their usual bookmaker margin levels if they think the public will bet on those odds regardless of the value. They rarely balance their books for each event (and it is not their primary aim to do so), but their aim is to consistently offer odds on the winners at a lower price than their fair value so that over the long term they will make profit.
In the case of short term form, if the recent form has no draws in it and the game appears to be a Win or Lose fixture, then there will be less interest in the draw. The bookmaker has his own market models and a market price manager who adds their own ideas on top of those. Their market model might see that short term run of few draws and may increase the draw odds in response to that. Usually, before releasing odds publicly, they release the odds privately to one or two “sharps” (expert bettors) who place their bets according to their own market models and ideas. If the sharps bet heavily on the home or away odds, then the bookmaker has another signal encouraging them to raise the draw odds. Once the odds are then released to the general public, they again adjust the price up or down as money comes in.
Description of this Backing the Draw Strategy
This Backing the Draw strategy aims to take advantage mostly of the second idea, the market price response to short term form. It looks for fixtures where both teams have not had draws for the last few games, but also not an overly long no-draw run that suggests they are a win or lose kind of a team. It then checks if their Pinnacle opening odds are in the specified opening odds band that has historically led to profit. This is the key point here, we are looking at the Pinnacle bookmaker opening odds that were published as a result of their market model and market price manager. If the data suggests that profit can be made by backing matches when this bookmaker releases opening odds in this odds range that also have this recent no-draw form, then we back the draw in these matches, not because we think it will be a draw, but because we think the draw odds are higher than their actual implied probability. Thus, over the long term, the data suggests we can make profit if this trend continues. The trend is of the market closing odds (any bookmaker or exchange, not just Pinnacle) being value when the Pinnacle opening odds of teams with this form are within the odds band we researched. We are basically saying that the market gets prices for these kinds of fixtures wrong over the long run. Must to clarify, the Pinnacle odds are just the trigger for us to bet, but we can place our bets on any bookmaker or betting exchange. In fact, we encourage you to pick the bookmaker with the best odds for that selection at the time you are ready to place bets.
This Backing the Draw strategy is betting against the short term trend. This is similar to our other recently updated strategy “Over 2.5 against the trend / Más 2.5 contra tendencia (Updated 2021-10-21)” which we explained in this article.
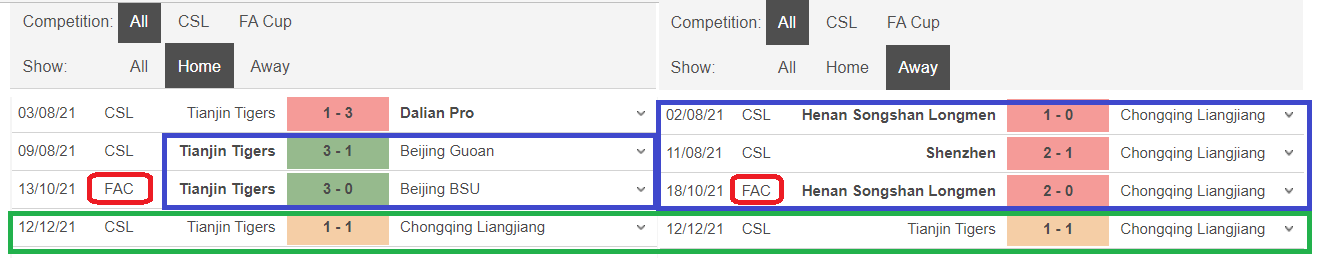
Here is an example of a game that would be a qualifying fixture for this:
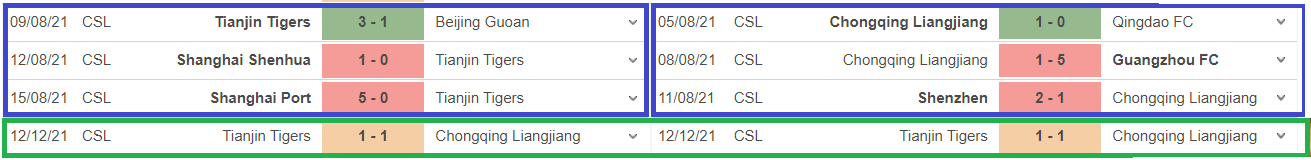
Both teams have not had draws in the recent term. Bettors may feel that the next game is also unlikely to be a draw if the trend continues. This was a fixture that was selected by the system and was a winner with a 1-1 draw result.
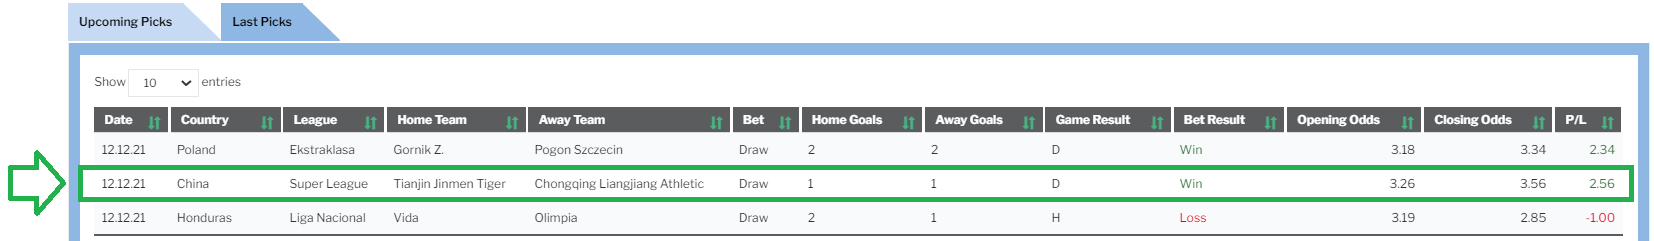
This pick’s opening odds were 3.26 and by kick-off they had risen to 3.56. This suggests that market pressures moved the odds higher as other selections were more heavily backed.
In the pre-match from the home team had not scored in their last 2 games and were roundly smashed 0-5 in their last game. The away team had scored in every match of their previous 3 games. The home team had only beaten the away team 2 out of the last 7 times they had met at their home ground. The form looks like a very even game with a slight advantage to the away team. If we look at the odds history for the 3 selections in this fixture we can see that the form suggests that the game was close, but once the public started overbacking the home team down into odds-on prices, the bookmakers had no option but to raise the odds on the draw and away win, even though the form makes it look an even game.
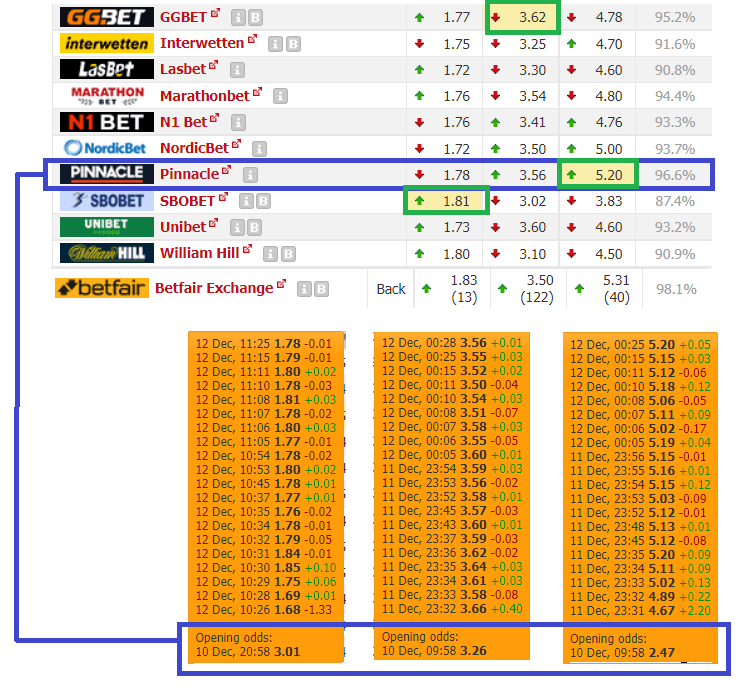
On the right hand side of the odds table, we can see the payout (sometimes called the bookmaker margin or overround of the book). For Pinnacle, they pay out 96%. This means that they offer odds that do not add up to a 100% payout. If punters bet evenly on all 3 outcomes, then they could get keep 4% of the money after paying out winnings. SBOBET is the worst in this, keeping 12.6% of the money bet on this market. People betting on them would have to overcome that -12.6% handicap on their edge just to break even. It is important to seek out bookmakers with low margins such as Pinnacle or betting exchanges such as Betfair.
We can also see from this that shopping around for the best odds is important since bookmaker prices vary and even a 1 tick better price on each bet can really improve profits in the long term. It is important to use odds comparison sites to get the best odds available for each bet.
The opening Pinnacle odds were 3.01 / 3.26 / 2.47. This clearly shows how unfancied the home team were with their short term results and long term head-to-head history. Despite this, once the public began betting on the match, the odds were pushed lower for the home team, all the way down from 3.01 to 1.78! There may have been some team news or some other reason why the home team was being so strongly backed.
If we look at the above image of home form only and away form only of the 2 two teams, the home team appears to have won their last 2 games by scoring 3 goals, while the away team has lost their last 3 away. This may be the form that the public views and decides that the home team is a 1.78 home win, not a 3.01 home win. One thing we should notice here is that the previous game was a cup match and not as comparable as league form which is against similar teams. This is one of the main reasons the Betamin Builder only uses league data for comparable statistics. Cups and friendlies introduce too many variables that can make the data less meaningful.
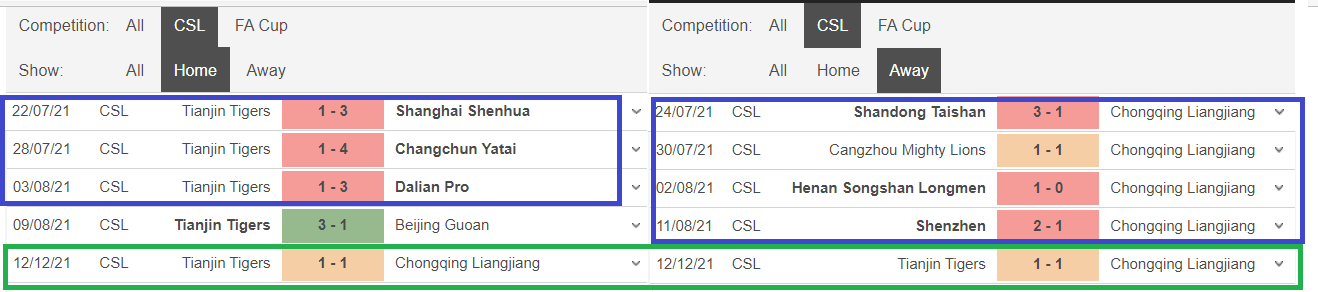
When we switch to only looking at league form (above), we start to see again the reasons why this game is not a strong home favourite. The home side has conceded at home in every game of their last 4, and let in 3 or more goals in 3 of those games, while the away side has scored in most of their away games. The market model had it mostly right, but the public felt differently and backed the home team into odds-on territory.
Another advantage of following betting strategies based on big data is that it avoids the risks of applying inconsistent gut betting based on incomparable data types such as cup, friendlies and league results. The Betamin Builder strategies stick to their system settings, and that consistency has a better chance of getting positive results than emotional, instinctive betting where punters can see things in the form that aren’t really there.
The main point of this explanation is to show that the public betting market pushes the odds into value territory for certain form patterns. Betaminic and its Betamin Builder tool automatically finds those fixtures and send those match picks to subscribers by email or even to their automated betting software if they have it. (See our Automated betting article here.)
Convinced? Start now -> You can follow this strategy easily by using this simple guide.
Opening and Closing Odds
Betaminic uses the opening odds to filter matches as strategy selections or not. We then use the closing odds to calculate the profit and loss. The reason for this is because the opening odds are the best reflection of the bookmaker model before it gets pushed around by open market forces. The opening odds often change quite quickly and it is unlikely that users will be able to get these odds after they have been published for a few hours. We use the closing odds to calculate profit and loss for a strategy since these are likely to be closer to the actual market odds available at most bookmakers close to Kick Off. This means you can place the bets at almost any bookmaker and the strategy will still work since the closing odds are likely to be close to the open market average odds near Kick Off. It is of course best betting practice to search for the highest odds available at the time you place your bet. This could be Pinnacle, Betfair Exchange, Bet365 or any other bookmaker that happens to be offering the best odds at the time you place your bet. Shopping around for the best odds, even if they are better by just one decimal point, can have a huge impact on system results over the long term. See our article about opening and closing odds here.
System Parameters Backing the Draw / Apostando al Empate (107 of 111 leagues) (Updated 2021-12-09)
These are the filters used for this system:
Leagues. We have tested this strategy with 111 leagues. 107 were selected.
Odds. Odds are taken from Pinnacle Sports, opening odds to select the games and closing odds to calculate the P/L.
Seasons. From season 2012/2013 to the current one 2021/2022.
Date range. From April 2012 to December 2021.
P/L Calculation method. To bet one unit on the draw, when the conditions are fulfilled.
Home Team conditions. The last three to five games played at home or away were not a draw.
Away Team conditions. The last three to five games played at home or away were not a draw.
Odds for Draw. Opening odds must be within the odds range of 3.09-3.29.
The Trigger of the system. If those conditions are fulfilled, the system places draw bet on the next fixture.
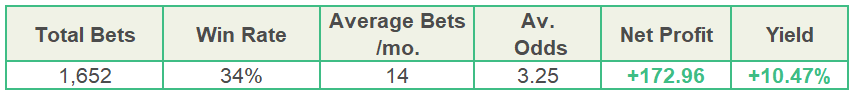
Yield. The Yield obtained in the system: 10.62% after 1,656 bets matched in the strategy.
Yield % = Net Profit or Loss / Total Stake * 100%
Results of this Strategy
Strategy Results by Year
Here you can see a breakdown of the results by year.
(Data from 2021-12-10)
Note: “2012” means the 2012 summer season leagues and the 2012/2013 winter season leagues.
The strategy results show incredible consistency with no losing seasons. There are seasons with high and low profits, but those correlate closely with natural variance (more or less draws than statistically usual). The average draw rate was 34% of matches over 10 years. The highest yield came in 2014 with a 30% yield and a 40% win rate. There were many more draws than usual in this season. The lowest yield came in 2015 with a yield of 1.37% and a 32% win rate. It is the negative variance swing back to the mean level of draws. This is statistics in action. The amazing thing about this strategy is that it makes profit even in those negative variance periods that return the draw average to its long term trend average. The highest profit actually came in 2016 with +50 points and a win rate of 39%, but more fixtures were found that year which meant it made more profit than 2014 even though it had a slightly lower yield.
In the long term, this strategy generates a yield (ROI) of 10.47%. There is a consistency and stability to this strategy that is rare to find, and it is only through powerful tools like the Betamin Builder that the process can be automated so that all you have to do is wait for the email alerts and place the bets., or even better, just setup automated betting and let it happen by the magic of technology.
Following Big Data Strategies Long Term
A key aspect of big data betting on value odds is the need to follow strategies long term. Giving up on a well-researched strategy after 2 losing months is exactly why most people lose out when trying this method of betting. Looking at the long term results will make this easier to see.
(Data from 2021-12-14)
The results show a steady, but bumpy increase in profits over time. The monthly results show how there are winning and losing months, and there are periods of 4 consecutive months of profits and even periods of 4 consecutive months of losses, but the long term trend is profit. It takes a special kind of bettor to be able to look at these results and make a long term plan that they can stick to in order to take advantage of these kinds of value trends. You need to be mentally aware of the winning and losing runs. You need to be practically prepared with a staking plan that works for your betting bank and that will be able to carry you through the losing months and make the most of the winning months.
Multiply Profits with the Right Staking Plan
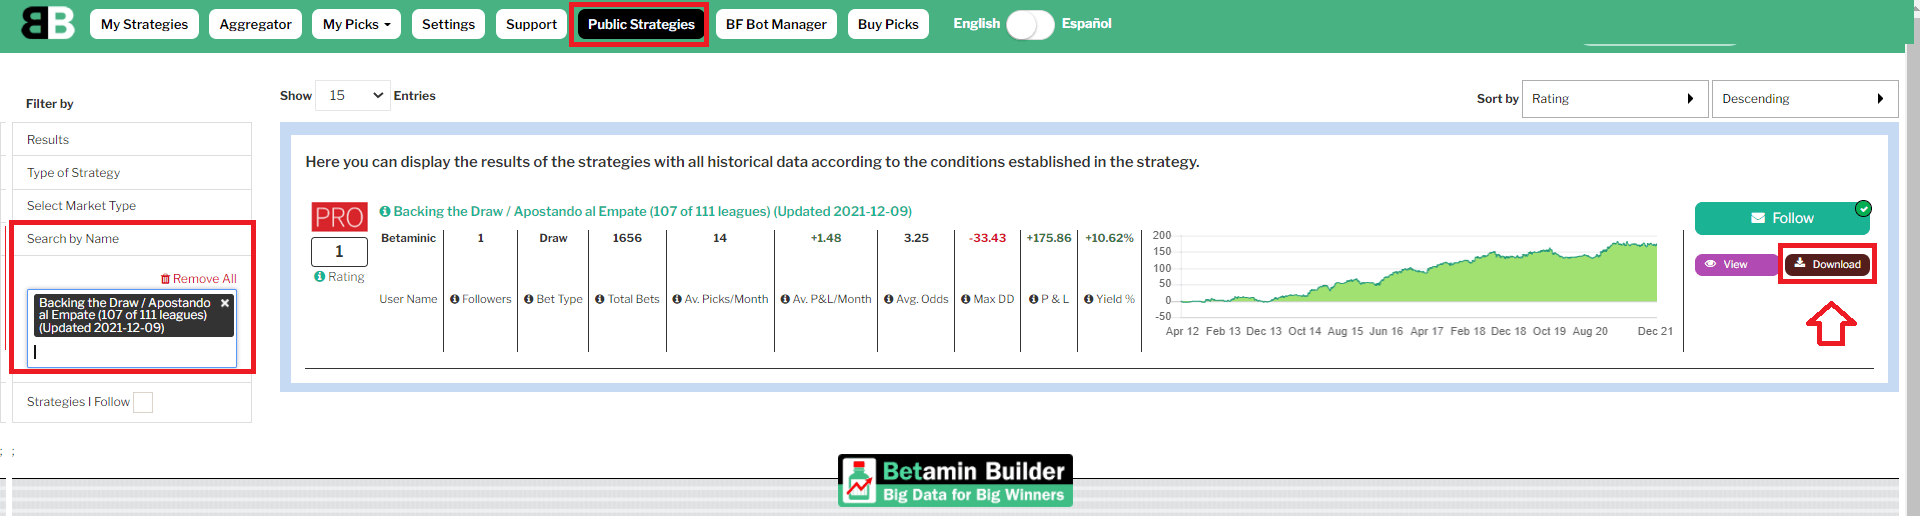
One of the big advantages of betting strategies researched with historical data is that we already have a lot of past data that can be analysed with staking software such as The Staking Machine. Many punters only have a few hundred bets of data to analyse their own betting system ideas or tipster history, but with this strategy we have 1,656 bets worth of data we can run a variety of tests on. You can easily download all the historical data of Betaminic strategies by clicking on the “Download” button for a strategy.
The right staking plan can multiply the profits to greater levels than these level stakes results show. See our article on the best staking plans here and our recommended Staking Plans book here (external link).
Staking Analysis for “Backing the Draw / Apostando al Empate (107 of 111 leagues) (Updated 2021-12-09)” strategy
Recommended Staking Plans:
Conservative: Percentage Staking betting 1% of the bank on each bet.
Aggressive: Target Profit Staking to win 3% of the bank from each bet or Secure Staking with these settings 4-3-2.5-1.5-0.5% for the 5 odds bands.
Very aggressive: 4321 Staking with 1 point as 1% of the bank at series start.
Percentage Staking increased the Level Staking profits by 114% from +176 to +378 points. Target Profit Staking increased profits by 250% to 618 points and 4321 Staking increased profits by 2,400% to 4401 points. This is why having the right staking plan is very important to getting the most out of Betaminic strategies.
Staking – Total Profit Analysis
The “Actual Total Profit” column shows the total profit of the actual results. The “MCS Ave. Total” column shows the average profit gained if the order of the results was shuffled 1,000 times. This kind of analysis is called a Monte Carlo Simulation (MCS). The point of this is that we want to be sure that the profits did not come as part of the “luck” of the fixture list. By shuffling the results, we can get a better image of how the staking plan would perform if the fixture list had been different. The above figures are based on that MCS Average Total figure. We consider these MCS columns of the most importance and highlight them in yellow. The “MCS Lowest bank trough” shows us what the lowest bank level reached was in all of the 1,000 Monte Carlo Simulations that were done. The “MCS Average lowest trough” shows us the average of all the 1,000 lowest bank troughs averaged out. These 2 figures are very useful for us when considering how aggressive a staking plan is and how low we should be mentally prepared for our bank to go.
The following table shows the results of various staking plans applied to the strategy results. The settings of each staking plan are based on the “Best Settings” taken from the extensively researched “The Staking Plans Book” , then tested and adjusted further using The Staking Machine (TSM) staking analysis software.
Table color key:
| wdt_ID | Color Key | Description |
|---|---|---|
| 1 | Blue background | Level Stakes |
| 2 | Dark green background | Conservative staking plans |
| 3 | Light green background | Aggressive staking plans |
| 4 | Orange background | Very Aggressive staking plans |
| 5 | White background | Inefficient staking plans |
| 6 | Red background | Bankrupt staking plans |
| 7 | Bold Type | Highlights the recommended staking plan of that risk category. |
| wdt_ID | Staking Plan | Actual Cumulative Profit | Actual ROI | Actual Largest Single Stake | Actual Average stake | Actual Highest Profit Peak | Actual lowest bank trough | MCS Ave. Total | MCS Average lowest trough | MCS Lowest bank trough | MCS Bankruptcy |
|---|---|---|---|---|---|---|---|---|---|---|---|
| 1 | 4321 Staking 4-3-2-1 1% | 3,471.20 | 3.30 | 466.59 | 63.51 | 5,733.24 | 58.61 | 4,401 | 65 | 4 | 0 |
| 2 | Recovery Type 3 2% R100% CR2 ONB2 | 3,015.31 | 5.33 | 251.37 | 34.18 | 4,168.66 | 81.47 | 2,182 | 76 | 19 | 0 |
| 3 | Square Root 0.25% | 1,263.01 | 4.31 | 102.89 | 17.69 | 1,736.76 | 95.07 | 994 | 93 | 79 | 0 |
| 4 | Dalembert 0.5% R7 | 566.96 | 6.50 | 45.08 | 5.27 | 754.14 | 75.47 | 885 | 81 | 22 | 0 |
| 5 | Parlay 1% R2 | 375.75 | 3.83 | 55.32 | 5.92 | 689.02 | 94.49 | 834 | 80 | 26 | 0 |
| 6 | Rolling Doubles 1% | 659.30 | 5.30 | 62.74 | 7.51 | 1,070.60 | 95.08 | 794 | 83 | 35 | 0 |
| 7 | Recovery 0.50% R100% CR10 ONB4 | 1,144.72 | 9.67 | 98.01 | 7.15 | 1,320.97 | 75.59 | 752 | 82 | 26 | 0 |
| 8 | Whitaker 3-2.5-3%TP | 616.94 | 6.82 | 22.83 | 5.46 | 784.07 | 89.94 | 618 | 88 | 40 | 0 |
| 9 | Target Profit 3% | 616.94 | 6.82 | 22.83 | 5.46 | 784.07 | 89.94 | 618 | 87 | 46 | 0 |
| 10 | Bookies Bank V2 1% LR2 | 460.77 | 7.07 | 21.15 | 3.94 | 605.44 | 89.09 | 508 | 88 | 50 | 0 |
| 11 | i-TSM Plan 1% EST34% >0-0-0-0-0 <5-5-5-5-5 | 462.61 | 7.50 | 17.51 | 3.73 | 611.56 | 91.48 | 489 | 90 | 45 | 0 |
| 12 | Pro 4% D5 | 568.21 | 10.50 | 27.45 | 3.27 | 668.21 | 94.08 | 396 | 87 | 41 | 0 |
| 13 | LP 28 1% | 411.35 | 8.06 | 20.77 | 3.08 | 541.32 | 94.87 | 390 | 90 | 48 | 0 |
| 14 | Secure 3-2.5-2-1-0.25% | 384.30 | 7.83 | 13.43 | 2.96 | 520.33 | 92.78 | 384 | 91 | 58 | 0 |
| 15 | Percentage 1% | 377.54 | 7.72 | 13.43 | 2.95 | 520.33 | 92.78 | 378 | 91 | 57 | 0 |
| 16 | Level 1 point | 175.86 | 10.62 | 3.95 | 1.00 | 281.77 | 93.86 | 176 | 91 | 50 | 0 |
| 17 | Coup Master 1% NC2 D1.25 SL5% | 125.30 | 7.26 | 15.94 | 1.04 | 259.78 | 90.18 | 167 | 88 | 35 | 0 |
| 18 | SAW 1% SL2 | 111.93 | 9.60 | 2.60 | 0.70 | 212.73 | 92.66 | 122 | 92 | 54 | 0 |
| 19 | Fibonacci 0.1% | 66.86 | 13.54 | 8.40 | 0.30 | 180.91 | 96.38 | 55 | 89 | 20 | 0 |
| 20 | Bookies Bank 0.1% | 19.51 | 10.38 | 0.43 | 0.11 | 120.18 | 99.38 | 20 | 99 | 95 | 0 |
| 21 | Kelly D50 Exp34 | 19.10 | 11.48 | 1.50 | 0.10 | 121.48 | 99.45 | 19 | 99 | 94 | 0 |
| 22 | Retirement 0.1% WO1.81 MD3 | 65.87 | 15.47 | 11.62 | 0.26 | 165.87 | 98.73 | 66 | 73 | -1,473 | 6 |
| 23 | Labouchere L1-H6 M26 | 2,529.48 | 13.18 | 59.94 | 11.59 | 2,656.16 | 52.61 | 2,025 | -22 | -538 | 52 |
| 24 | 1 Point 1% Fp1V1 | 1,669.86 | 11.78 | 203.82 | 8.56 | 1,769.86 | -60.77 | 1,606 | -452 | -10,936 | 75 |
Staking – Profit Taking Analysis
The above table shows the results if you started following the strategy from 2012 and never withdrew profits over the next 10 years. This is unrealistic. Also, it does not show us how the strategy fares if we started at different times in its history, and also if we joined the system after a good run, which is often the case. People usually follow strategies just after good winning runs, not losing runs. In this next table we apply “Profit Taking” to the staking plan tests. With Profit Taking, the bank is reset to its starting level each time it doubles. So if it started on 100 points, and doubled to 200 points, then 100 points profit was removed and the staking plan continues. Now, if we look at the “MCS Ave. Total” column for 4321 Staking we can see +566 points instead of the +4401 points that was in the previous table. These are the SAME profits, except the +566 number means that the bank doubled FIVE times, and is currently +66 points up in its current cycle. (100 profit taken + 100 profit taken + 100 profit taken + 100 profit taken + 100 profit taken + 66 current profit) This means that on five occasions it doubled its bank, then had its bank reset to 100 and started again. If we had joined the strategy after that winning run of doubling its bank, it would have had another winning run again. This is a much better way to test staking plans. And then we can run Monte Carlo Simulations with Profit Taking and test out that method in 1,000 simulated shuffles of the data.
After this analysis, we found the 4 recommended staking plans that we stated earlier.
Conservative: Percentage Staking betting 1% of the bank on each pick.
Aggressive: Target Profit Staking to win 3% of the bank from each bet or Secure Staking with these settings 4-3-2.5-1.5-0.5% for the 5 odds bands.
Very aggressive: 4321 Staking with 1 point as 1% of the bank at series start.
Table colour key:
| wdt_ID | Color Key | Description |
|---|---|---|
| 1 | Blue background | Level Stakes – This is the staking plan to compare all other staking plans to. If a staking plan does not improve on level stakes, it is not worth considering. The efficiency of a staking plan is based on how much it can multiply the profits of level stakes. Note that the profit is +176 points, the MCS Average Lowest Trough is 84% and the MCS Average Lowest Trough is 29%. |
| 2 | Dark green background | Conservative staking plans – These are staking plans whose MCS Average Lowest Trough is 84% or higher and whose MCS Lowest Bank Trough is 48%. You would need to be mentally be prepared that your bank is likely to dip to 84% but would break all historical trends if it is went under 48%. |
| 3 | Light green background | Aggressive staking plans – These are staking plans whose MCS Average Lowest Trough is 72% or higher and whose MCS Lowest Bank Trough is 31%. You would need to be mentally be prepared that your bank is likely to dip to 72% but would break all historical trends if it is went under 31%. |
| 4 | Orange background | Very Aggressive staking plans – These are staking plans whose MCS Average Lowest Trough is 31% or higher and whose MCS Lowest Bank Trough is 4%. You would need to be mentally be prepared that your bank is likely to dip to 31% but would break all historical trends if it is went under 4%. This basically risks the entire bank for the highest possible gain, but without going bankrupt in testing on historical results data. |
| 5 | White background | Inefficient staking plans – These staking plans did not improve on level stakes in terms of profit, and so are not considered. |
| 6 | Red background | Bankrupt staking plans – These staking plans went bankrupt and their settings are too dangerous to be considered. |
| 7 | Bold Type | Highlights the recommended staking plan of that risk category. |
| wdt_ID | Staking Plan | Actual Cumulative Profit | Actual ROI | Actual Largest Single Stake | Actual Average stake | Actual Highest Profit Peak | Actual lowest bank trough | MCS Ave. Total | MCS Average lowest trough | MCS Lowest bank trough | MCS Bankruptcy |
|---|---|---|---|---|---|---|---|---|---|---|---|
| 1 | 4321 Staking 4-3-2-1 1% | 562.94 | 10.30 | 16.99 | 3.30 | 195.86 | 39.38 | 566 | 31 | 4 | 0.00 |
| 2 | Recovery Type 3 2% R100% CR2 ONB2 | 509.44 | 11.20 | 13.49 | 2.75 | 199.57 | 42.57 | 465 | 49 | 13 | 0.00 |
| 3 | Percentage 2% | 400.49 | 9.63 | 10.66 | 2.51 | 198.36 | 81.95 | 407 | 61 | 19 | 0.00 |
| 4 | Target Profit 4% | 358.08 | 9.83 | 7.86 | 2.20 | 199.82 | 78.68 | 363 | 66 | 29 | 0.00 |
| 5 | 4321 Staking 4-3-2-1 0.5% | 341.20 | 10.29 | 9.92 | 2.00 | 199.73 | 68.01 | 360 | 64 | 26 | 0.00 |
| 6 | Secure 4-3-2.5-1.5-0.5% | 318.49 | 10.42 | 7.64 | 1.85 | 199.12 | 64.12 | 321 | 72 | 31 | 0.00 |
| 7 | Rolling Doubles 1% | 301.13 | 10.18 | 11.30 | 1.79 | 195.73 | 70.63 | 317 | 69 | 26 | 0.00 |
| 8 | Dalembert 0.5% R7 | 255.42 | 8.59 | 14.34 | 1.80 | 197.13 | 60.39 | 317 | 63 | 22 | 0.00 |
| 9 | Parlay 1% R2 | 226.65 | 6.90 | 14.73 | 1.98 | 198.67 | 80.35 | 317 | 63 | 20 | 0.00 |
| 10 | Recovery 0.50% R100% CR10 ONB4 | 357.88 | 11.52 | 15.25 | 1.88 | 197.51 | 61.09 | 297 | 65 | 24 | 0.00 |
| 11 | Bookies Bank V2 1% LR3 | 315.42 | 11.55 | 8.89 | 1.65 | 198.28 | 59.93 | 294 | 71 | 28 | 0.00 |
| 12 | Target Profit 3% | 282.52 | 9.37 | 5.91 | 1.82 | 199.73 | 84.74 | 290 | 76 | 35 | 0.00 |
| 13 | Whitaker 3-2.5-3%TP | 282.52 | 9.37 | 5.91 | 1.82 | 199.73 | 84.74 | 290 | 75 | 35 | 0.00 |
| 14 | Bookies Bank V2 1% LR2 | 241.12 | 9.64 | 6.59 | 1.51 | 196.79 | 82.16 | 258 | 79 | 39 | 0.00 |
| 15 | i-TSM Plan 1% EST34% >0-0-0-0-0 <5-5-5-5-5 | 242.58 | 10.61 | 5.81 | 1.38 | 198.98 | 78.73 | 252 | 80 | 40 | 0.00 |
| 16 | Pro 4% D5 | 287.50 | 11.68 | 8.70 | 1.49 | 199.74 | 82.49 | 249 | 77 | 36 | 0.00 |
| 17 | LP 28 1% | 231.28 | 11.18 | 8.57 | 1.25 | 199.25 | 82.48 | 225 | 83 | 43 | 0.00 |
| 18 | Secure 3-2.5-2-1-0.25% | 223.22 | 11.17 | 4.90 | 1.21 | 199.54 | 79.70 | 224 | 84 | 48 | 0.00 |
| 19 | Percentage 1% | 221.56 | 11.11 | 4.90 | 1.20 | 199.54 | 79.66 | 222 | 84 | 48 | 0.00 |
| 20 | Level 1 point | 175.86 | 10.62 | 3.95 | 1.00 | 199.92 | 84.24 | 176 | 84 | 29 | 0.00 |
| 21 | Coup Master 1% NC2 D1.25 SL5% | 142.06 | 12.11 | 10.98 | 0.71 | 199.51 | 87.05 | 127 | 82 | 43 | 0.00 |
| 22 | SAW 1% SL2 | 111.93 | 9.60 | 2.60 | 0.70 | 198.35 | 69.47 | 122 | 88 | 42 | 0.00 |
| 23 | Square Root 0.25% | 98.35 | 8.80 | 21.54 | 0.68 | 189.98 | 91.70 | 109 | 91 | 81 | 0.00 |
| 24 | Fibonacci 0.1% | 66.86 | 13.54 | 8.40 | 0.30 | 180.91 | 96.38 | 54 | 89 | 29 | 0.00 |
| 25 | Bookies Bank 0.1% | 19.51 | 10.38 | 0.43 | 0.11 | 120.18 | 99.38 | 20 | 99 | 93 | 0.00 |
| 26 | Kelly D50 Exp34 | 19.10 | 11.48 | 1.50 | 0.10 | 121.48 | 99.45 | 19 | 99 | 93 | 0.00 |
| 27 | Square Root 1.5% | 491.64 | 11.15 | 25.28 | 2.66 | 199.59 | 52.53 | 447 | 51 | -19 | 0.10 |
| 28 | Level 2 points | 351.72 | 10.62 | 7.90 | 2.00 | 199.84 | 55.96 | 352 | 59 | -43 | 1.60 |
| 29 | Retirement 0.1% W3.26 MD3 | 65.87 | 15.47 | 11.62 | 0.26 | 165.87 | 98.73 | 66 | 76 | -1,329 | 6.19 |
Staking Plan analysis Summary
Conservative: Percentage Staking +26% on Level stakes
Betting 1% of the betting bank on each bet increased the level stakes MCS Average Total profits by +26% from 176 to 222 points. Most notably, Level Stakes MCS lowest bank trough was 29 but Percentage stakes brings that up to a much safer 48. Level Stakes MCS Average Lowest Trough was 84 and Percentage staking keeps that 84 average. So we can confidently say that Percentage staking improves on Level stakes since it increases profits while reducing risk. If you followed this staking plan, you should be mentally prepared for the bank to drop to 84% of its starting level in most betting cycles, and that it could even go as low as 48% of its starting level. If you followed this staking plan for this strategy, then your stop-loss point would be 48. That means if your starting bank was 1,000 and it went below 480, then it would have broken all historical lows.
Aggressive: Target Profit Staking +64% on Level stakes
Betting to win 3% of the bank from each bet increased the level stakes MCS Average Total profits by +64% from 176 to 290 points. Level Stakes MCS lowest bank trough was 29 but Target Profit Staking brings that up to a slightly better 35. Level Stakes MCS Average Lowest Trough was 84 but Target Profit Staking is slightly more aggressive and has a 76 average. So we can say that Target Profit Staking increases profits but also increases the volatility of the bank. If you followed this staking plan, you should be mentally prepared for the bank to drop to 76% of its starting level in most betting cycles, and that it could even go as low as 35% of its starting level. If you followed this staking plan for this strategy, then your stop-loss point would be 35. That means if your starting bank was 1,000 and it went below 350, then it would have broken all historical lows.
Another aggressive option is Secure Staking with these settings. 82% on Level stakes
wdt_ID Odds Bracket Stake Size
1
1.01-1.49
Bet 4% of bank
2
1.50-1.99
Bet 3% of bank
3
2.00-2.49
Bet 2.5% of bank
4
2.50-4.49
Bet 1.5% of Bank
5
4.50+
Bet 0.5% of bank
| wdt_ID | Odds Bracket | Stake Size |
|---|---|---|
| 1 | 1.01-1.49 | Bet 4% of bank |
| 2 | 1.50-1.99 | Bet 3% of bank |
| 3 | 2.00-2.49 | Bet 2.5% of bank |
| 4 | 2.50-4.49 | Bet 1.5% of Bank |
| 5 | 4.50+ | Bet 0.5% of bank |
Secure staking bets a different percentage of the bank depending on the odds of the bet, with more bet on lower odds and less on higher odds. The results are slightly better than Target Profit staking but has slightly lower lows. Secure Staking increased the level stakes MCS Average Total profits by +82% from 176 to 321 points. Level Stakes MCS lowest bank trough was 29 but Secure Staking brings that up to a slightly better 31. Level Stakes MCS Average Lowest Trough was 84 but Secure Staking is slightly more aggressive and has a 72 average. So we can say that Secure Staking increases profits but also increases the volatility of the bank. If you followed this staking plan, you should be mentally prepared for the bank to drop to 72% of its starting level in most betting cycles, and that it could even go as low as 31% of its starting level. If you followed this staking plan for this strategy, then your stop-loss point would be 31. That means if your starting bank was 1,000 and it went below 310, then it would have broken all historical lows.
Very aggressive: 4321 Staking +321% on Level stakes
4321 Staking is where you bet 4 times the base stake on Bet 1, If Bet 1 wins, you reduce stakes and bet 3 times the base stake on Bet 2. If Bet 2 wins, you reduce stakes again and bet 2 times the base stake on Bet 3. If Bet 3 wins, you reduce stakes one more time to bet 1 times the base stakes on Bet 4 and for any further bets as long as the series keeps winning. The series is reset if there is a loss. So if Bet 1 lost, we would bet 4 on the next bet, and keep betting 4 until we hit a winner, then we bet 3 on the next. The idea is to bet less after a winner when there is less chance of a winner coming. For draw bets, we are very unlikely to get 3-4 winners in a row, so it makes sense to bet less on subsequent bets after such good runs.
4321 Staking with 1 point as 1% of the bank at series start increased the level stakes MCS Average Total profits by +321% from 176 to 566 points. Level Stakes MCS lowest bank trough was 29 but 4321 Staking goes down as far as 4. Level Stakes MCS Average Lowest Trough was 84 but 4321 Staking often goes as low as 31. So we can say that 4321 Staking improves on Level Stakes profit but with a big increase in risk and bank variance. If you followed this staking plan, you should be mentally prepared for the bank to drop to 31% of its starting level in most betting cycles, and that it could even go as low as 4% of its starting level. If you followed this staking plan for this strategy, then your stop-loss point would be 4. That means if your starting bank was 1,000 and it went below 40, then it would have broken all historical lows. This is an incredibly aggressive staking plan, but if your aim is to risk your entire betting bank that you have allotted this strategy, then 4321 Staking would be the most efficient way to squeeze the most opportunity out of this strategy and the allotted betting capital. In none of the simulations did the bank go bankrupt, but the bank very regularly had big ups and downs.
Which staking plan to use is up to each user’s own betting style. If you have a large bank which you want to protect, then the conservative staking plan is best. Or if you are okay with some more risk and can handle a few occasional lows, then the aggressive stakes might be suitable for you. If you have a smaller betting bank and are okay with putting the entire bank at risk for maximum upside, then the very aggressive staking plan is still smarter than other forms of betting where you put the entire bank on a “banker” treble.
Strategy Results Analysis
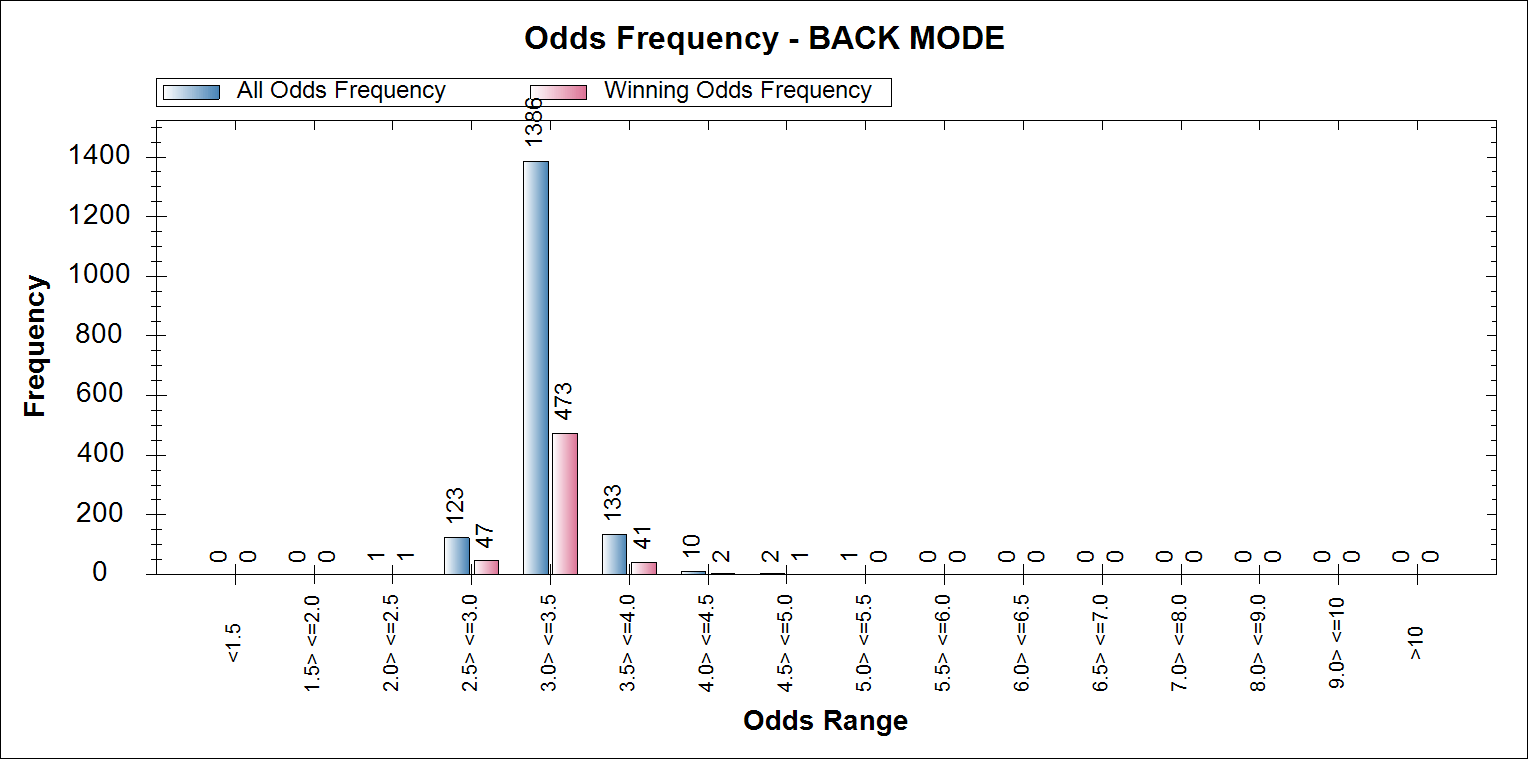
The bar chart shows that most bets fall in the 3.0 to 3.5 odds range. But it is it interesting to note that the opening odds band of this strategy is 3.09 – 3.29. So all the opening odds are in that range, but from the time when the odds were publicly released until kick-off, the odds get adjusted up or down with a number of bets of odds in the 2.5-3.0 range and even 1 as high as the 5.0 – 5.5 range and as low as the 2.0-2.5 range. This makes the next chart even more interesting.
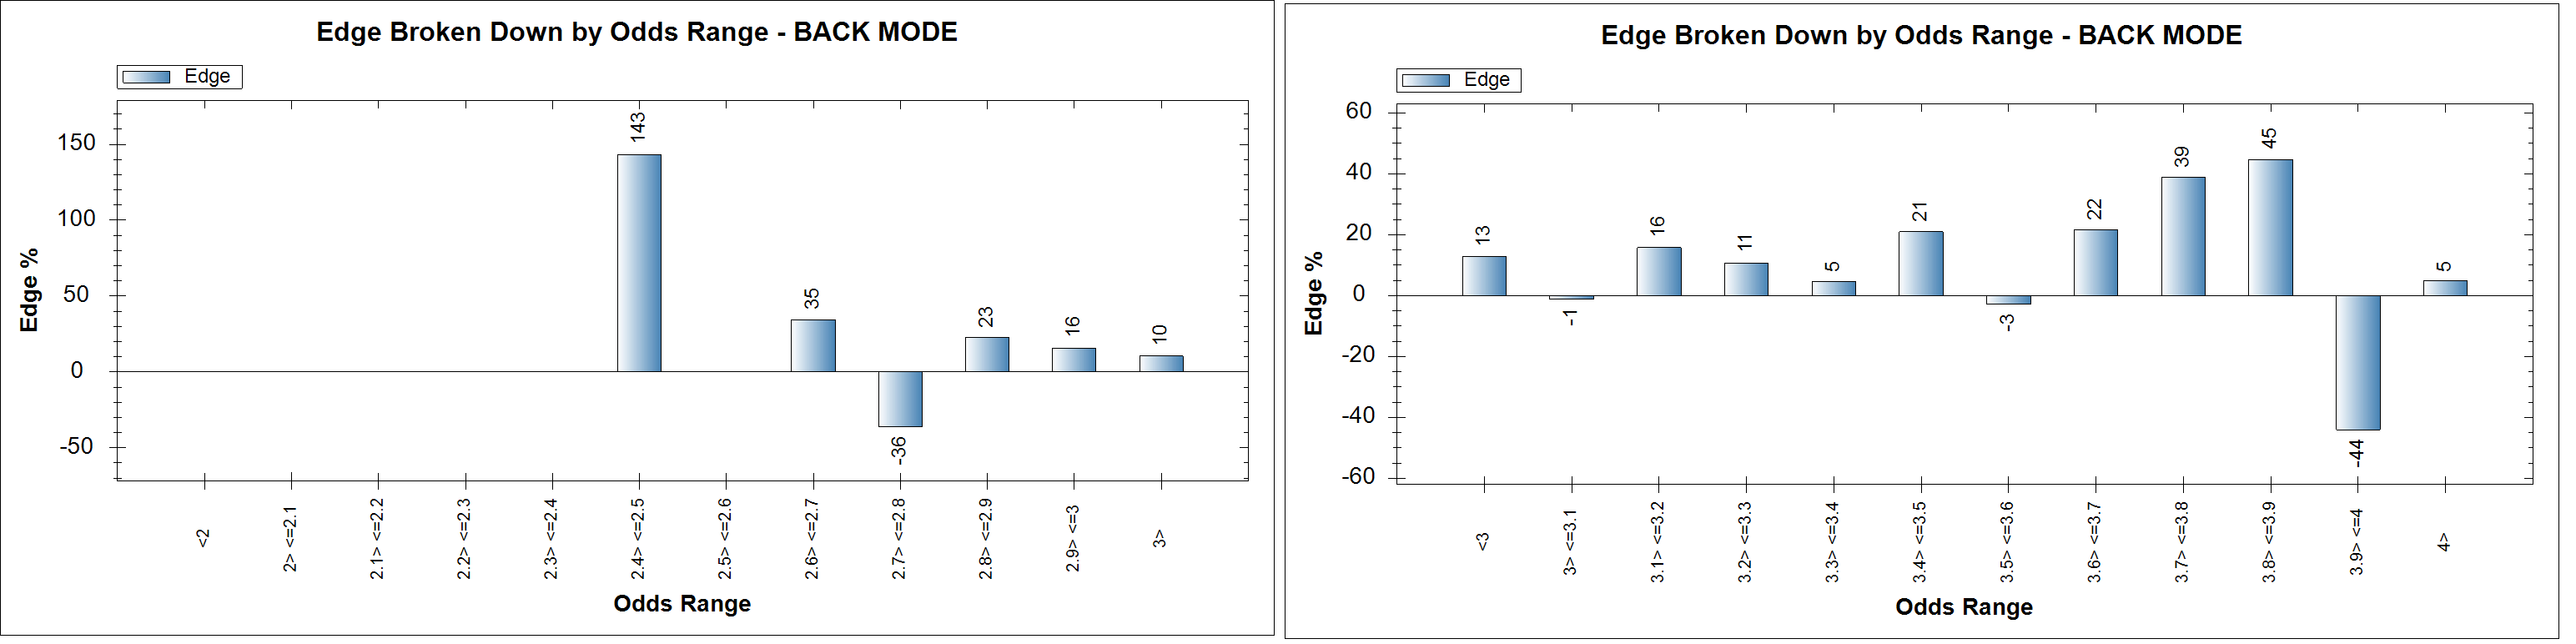
When we look at the yield by closing odds bands, we can see profit is made by both the odds that are adjusted above the 3.09-3.29 starting range and the odds that get pushed under the 3.09-3.29 range. So the fact that the odds go up or down does not reduce the value nature of these odds. Over the long term, the market gets these fixtures wrong and the closing draw odds are above their actual fair value. It is worth noting that the odds that do go above the 3.29 point generate better yields than the odds that go under 3.09, but they both make positive yields. The “edge” in the chart means the same as “yield” or “ROI”.
The Staking Machine software provides very useful information about the data set.
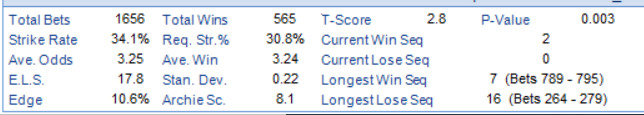
It shows an Expected Losing Sequence (E.L.S.) of 17.8 and an actual longest losing sequence of 16. The ELS is calculated based on the strike rate and the number of bets. From this it can calculate the statistically expected longest losing sequence. We can see that these results did indeed come close to that expected longest losing run. So this also suggests the profits are not a result of unusual positive variance (luck). When considering any staking plan for this strategy, we should consider what would happen if we lost 16 bets in a row. In the staking plans we suggested above, none of them went bankrupt, but some of them had their betting bank hard hit.
We see the Archie Score is 8.1, the T-Score is 2.8 and the P-Value is 0.003. All three of these are different ways of calculating the likelihood of the results being down to chance or real edge. An Archie Score of 8.1 suggests a 1% chance that the results are just luck. The T-Score of 2.8 and P-Value of 0.003 suggest there is a 0.03% chance that these results are down to luck. These are really strong numbers that support the strategy results as having found a real trend, and not the result of data mining. The P-Value is the most advanced of the calculated probability (luck) quantifying methods and we often look at this number when judging strategies. The data also suggests that even though the strike rate is 34.1%, we only need a strike rate of 30.8% to break even thanks to the 10.6% edge.
Drawdown
The maximum drawdown for each year gives us an idea of the kind of bad runs the strategy can go on. This helps us judge the risk of this strategy.
| wdt_ID | Seasons | Total Bets | % Bet Won/Lost | Max DD | P & L | Yield % |
|---|---|---|---|---|---|---|
| 1 | 10 seasons | 1,652 | 34 | -33.43 | 172.96 | 10.47 |
| 2 | 2012 | 77 | 34 | -10.50 | 7.24 | 9.40 |
| 3 | 2013 | 92 | 34 | -18.73 | 7.20 | 7.83 |
| 4 | 2014 | 117 | 40 | -15.74 | 35.28 | 30.15 |
| 5 | 2015 | 171 | 32 | -21.88 | 2.35 | 1.37 |
| 6 | 2016 | 198 | 39 | -18.71 | 50.20 | 25.35 |
| 7 | 2017 | 151 | 36 | -12.53 | 25.86 | 17.13 |
| 8 | 2018 | 255 | 32 | -28.71 | 10.26 | 4.02 |
| 9 | 2019 | 216 | 31 | -32.95 | 3.19 | 1.48 |
| 10 | 2020 | 196 | 35 | -12.67 | 25.79 | 13.16 |
| 11 | 2021 | 179 | 31 | -14.45 | 5.59 | 3.12 |
It is interesting to see that the average percentage of bets won over 10 years was 34% and the biggest drawdown was -33 points. The weakest year, 2019 had a win rate of just 31%. This suggests that the problem was not the strategy, simply that a period of extreme negative variance occurred where fewer games than normal finished as draws. Knowing the maximum drawdown can help us plan ahead for such natural variations.
Filter analysis
| wdt_ID | Data Set | Total Bets | Av. Picks/Month | Av. P&L/Month | % Bet Won | Avg. Odds | Max DD | P & L | Yield % |
|---|---|---|---|---|---|---|---|---|---|
| 1 | 2012-2021 ALL Leagues, ALL odds, NO objective form filters | 230,295 | 1,917 | -74.69 | 26 | 3.82 | -8,996.38 | -8,972.50 | -3.90 |
| 2 | 2012-2021 ALL leagues, ALL odds, 3-5 games no draws | 13,969 | 118 | -2.90 | 26 | 3.88 | -388.86 | -344.00 | -2.46 |
| 3 | 2012-2021 ALL leagues, 3.09-3.29 Pinnacle opening odds, 3-5 games no draws | 1,937 | 16 | 1.10 | 33 | 3.25 | -40.15 | 129.69 | 6.70 |
| 4 | 2012-2021 107 leagues, 3.09-3.29 Pinnacle opening odds, 3-5 games no draws | 1,652 | 14 | 1.46 | 34 | 3.25 | -33.43 | 172.96 | 10.47 |
Even more promising data from this strategy is how the strategy fares with different filters applied to it. First of all, if we apply no filters and bet on every match to be a draw, we would have bet on 230,295 matches and had a -3.90% yield with a win rate of 25%. That means that 1 in 4 of every football match is a draw. The -3.90% is the bookmaker’s margin. Pinnacle have got their margin perfect overall. They are getting the 4% they intended for. But if we apply just our objective form filters (3-4 games with no draws) then that yield is cut to -2.46%. This is with no odds filtering yet. That means that this strategy has eaten away at the bookmaker margin already. When we then apply odds filtering to only focus on matches with draws in the sweet zone where it is not a super strong draw expectation but also not an unexpected result, the 3.09-3.29 range, then we get into profit across all leagues at an impressive 6.70% yield. By removing leagues with over 50 bets and making losses, we can remove leagues that the bookmaker must be taking special care of and keeping their odds lower than they do for other leagues. This may be because their pricing manager has special opinions about these leagues and adjusts accordingly, or it may be that the market does not affect these leagues’ prices so much and they remain without value. With the remaining 107 leagues, we have an incredible 10%+ yield. The main point here is that the objective form filters reduce the bookmaker’s margin even before we started odds filtering or league filtering. This is another important sign that the strategy is based on a real trend in the market odds.
Minimum Suggested Odds & Getting the Best Odds
We will send the picks by email with “minimum suggested odds”. These are also shown in your “Pending Picks” page. These minimum recommended odds mean you will have a reference point to place your bets. The calculations are performed to obtain a theoretical yield of 5% betting on the minimum odds, always based on past data. It means that if you had always bet using the minimum odds, you would have achieved a 5% yield with the historical data of the strategy. The displayed results of a strategy and the strategy results in this article include all bets made, including those under the recommended odds. But we feel yields can be improved by taking note of the minimum recommended odds. Some users do also bet on all the picks. The final choice is with you. We strongly advise opening accounts with different bookmakers to be able to select the highest odds available for each bet. Getting just a few ticks higher on each bet can have a big impact on long term profits.
Would you like to receive the picks of the strategy?
It’s very easy, you just have to follow some very simple steps:
- Register on our website, click here to go directly.
- Buy the package you want to receive the picks of the strategy. Click here to select a plan.
- Access our Betamin Builder tool.
- Go to “Public Strategies” in the Main Menu.
- Activate the option to receive the Picks by clicking on the email icon, which you will find to the right of the strategy “Backing the Draw / Apostando al Empate (107 of 111 leagues) (Updated 2021-12-09)” strategy.
- You don’t have to do anything else. You will start receiving the picks in your email account as soon as the games fulfil the conditions of the strategy (check your SPAM folder). You can also see picks for matches due to kick-off within the next 48 hours in your “My Picks” > “Pending Picks” page.
If you have any doubts in the process, you can see the tutorial that we have prepared to follow the public strategies. Click here to access the tutorial.
Conclusions
As you can see, this system makes profit across 107 different leagues. That shows that this strategy is pretty solid, because the conditions and filters work for a large number of different football leagues.
We think this strategy shows strong historical trends and can be profitable over the long term. But as you know, this strategy is based 100% on historical data. As with any strategy based on historical data, it can give us a promising strategy to follow, but nobody can be sure this system will continue making profits in the future. So you should monitor the strategy for signs of it reaching your stop loss point.
It takes a lot of research to take an idea for a betting system, test it against historical data, carefully analyse by year, league and odds band to make sure we have a base strategy with level stakes profits over the long term. We check the Archie score, P-value, ELS and Max drawdowns to see how much we can trust the system and what risks we should plan for. We then analyse staking plans to find ways to get more value out of it. At the end we are confident to say that if you want to try out big data betting with the Betaminic method, then this strategy is the perfect way to start.
Looking at the bigger picture and turning individual Betaminic strategies into a full betting system, we advise and recommend you not to pull all your eggs in one basket. Spread risk by diversifying the strategies in your betting system portfolio, such as also following another of our recommended strategies, the Over 2.5 Goals strategy here. This can help hedge against natural statistical variance. You can choose more strategies from the Public Strategies page. You can take ideas from the Public Strategies to edit and adapt in your own way. You can also create your own private strategies based on your own gut feelings and ideas about football. We are here to help you build your betting system, by publishing more studies of this nature, by helping you follow or create strategies and by answering any questions you may have.
If you want to suggest a particular betting system to be analysed in more detail, please send us an email to su*****@*******ic.com or using our contact form, we will be glad to help you.
If you are looking for somewhere to start, then following this strategy is a great way to get used to the Betaminic system and big data betting.
Sign up for Betaminic for free here.
Read the tutorial for using Betaminic.
Read more about value odds here.